- Bitcoin price gained bullish momentum and broke the $5,200 resistance against the US Dollar.
- The price even broke the $5,300 level and it is currently trading with a positive bias.
- Yesterday’s di...
- Bitcoin price gained bullish momentum and broke the $5,200 resistance against the US Dollar.
- The price even broke the $5,300 level and it is currently trading with a positive bias.
- Yesterday’s discussed key bearish trend line was breached near $5,150 on the hourly chart of the BTC/USD pair (data feed from Kraken).
- The pair traded towards the $5,380 resistance level and it could continue to move higher.
Bitcoin price finally gained traction above $5,200 and $5,300 against the US Dollar. BTC price is back in a bullish zone and it could even surpass the $5,400 resistance level in the near term.
Bitcoin Price Analysis
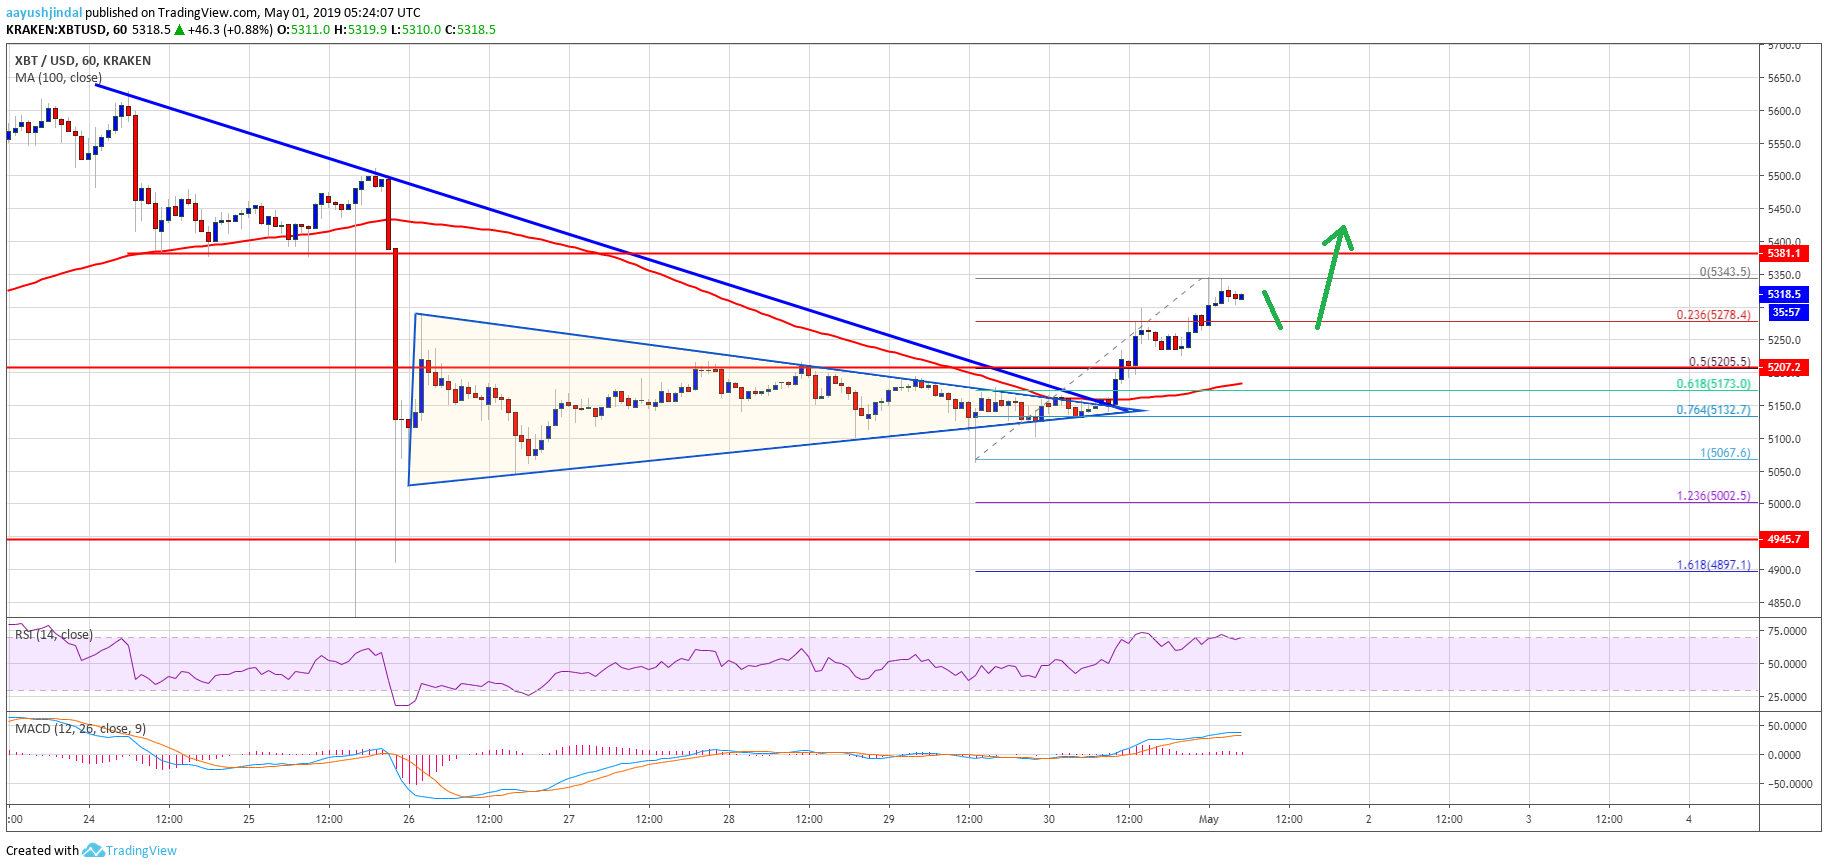
Yesterday, we saw tight range moves in bitcoin price below the $5,160 resistance against the US Dollar. The BTC/USD pair struggled to clear the $5,160 and $5,200 resistance levels on many occasions. However, the bulls had the upper hand as they succeeded in pushing the price above the $5,160 and $5,200 resistance levels. There was a break above the 50% Fib retracement level of the decline from the $5,510 high to $4,905 low.
More importantly, yesterday’s discussed key bearish trend line was breached near $5,150 on the hourly chart of the BTC/USD pair. The pair even cleared the crucial triangle resistance near the $5,140 level. It opened the doors for more gains above the $5,250 resistance and the 100 hourly simple moving average. The bulls pushed the price above the $5,300 level and a new weekly high was formed near the $5,343 level. At the moment, the price is consolidating gains above $5,300. An initial support is at $5,280 and the 23.6% Fib retracement level of the recent wave from the $5,067 low to $5,343 high.
If there is a downside correction below the $5,280 level, the price could test the $5,200 support area. It coincides with the 50% Fib retracement level of the recent wave from the $5,067 low to $5,343 high. The main support is near the $5,160 level and the 100 hourly simple moving average. On the upside, an initial resistance is near the $5,380 level. A clear break above the $5,380 resistance will most likely call for more gains above $5,400.
Looking at the chart, bitcoin price clearly moved into a positive zone with a close above $5,200 and the 100 hourly simple moving average. In the short term, there could be a downside correction, but the bulls are likely to defend $5,250 or $5,200. Overall, bitcoin price is trading with a positive bias and likely to climb above $5,400.
Technical indicators:
Hourly MACD – The MACD is currently in the bullish zone, with positive signs.
Hourly RSI (Relative Strength Index) – The RSI for BTC/USD climbed above 60 and it is currently near 75.
Major Support Levels – $5,250 followed by $5,200.
Major Resistance Levels – $5,380, $5,400 and $5,440.
The post Bitcoin (BTC) Price Signaling Bullish Continuation Above $5,400 appeared first on NewsBTC.
source https://www.tokentalk.co/NewsBTC/bitcoin-btc-price-signaling-bullish-continuation-above-5400-5cc93d615e27663e7ced63c3
Wednesday, 1 May 2019
Bitcoin (BTC) Price Signaling Bullish Continuation Above $5,400 @newsbtc #Analysis #Technical #bitcoin #btc
Subscribe to:
Post Comments (Atom)
This analyst says there’s a “high chance” Bitcoin may never fall under $5k again @cryptoslate #Analysis #Price Watch
Once Bitcoin (BTC) started to incur strong losses in the second half of 2019, analysts were once again making extremely low price prediction...

-
The Indian Ministry of Commerce and Industry announced yesterday that the Coffee Board in the country is integrating blockchain into the cof...
-
App-enabled cryptocurrency exchange and wallet provider, Zebpay, has announced that it is enabling Lightning Network payments for all its ...
-
Once Bitcoin (BTC) started to incur strong losses in the second half of 2019, analysts were once again making extremely low price prediction...


No comments:
Post a Comment