- Bitcoin price started a strong rise above the $7,800 and $8,000 resistances against the US Dollar.
- The price gained traction and even traded close to the $8,200 resistance area.
- This week’s follo...
- Bitcoin price started a strong rise above the $7,800 and $8,000 resistances against the US Dollar.
- The price gained traction and even traded close to the $8,200 resistance area.
- This week’s followed important declining channel was breached near $7,960 on the hourly chart of the BTC/USD pair (data feed from Kraken).
- The pair is currently forming a triangle pattern and it could continue higher above $8,150 and $8,200.
Bitcoin price jumped back into a positive zone above $7,800 against the US Dollar. BTC is currently forming a bullish pattern and it may continue to rise towards $8,300 an 8,500 in the near term.
Bitcoin Price Analysis
Recently, we saw a strong bounce in bitcoin price from the $7,475 swing low against the US Dollar. The BTC/USD pair surged higher and broke many hurdles near $7,700 and $7,800. There was even a break above the $8,000 level and the 100 hourly simple moving average. It seems like the bulls are back in action and the price completed a downside correction near the $7,500 support area. This also suggests that there are chances of more gains above the $8,200 level.
Recently, this week’s followed important declining channel was breached near $7,960 on the hourly chart of the BTC/USD pair. The pair spiked towards the $8,200 level and formed an intraday high at $8,180. The price is currently consolidating gains above $8,000. Moreover, it traded below the $8,100 level and the 23.6% Fib retracement level of the upward move from the $7,475 low to $8,180 high. However, the broken resistance near the $7,960 and $8,000 levels is currently acting as a strong support.
Besides, the pair is currently forming a triangle pattern with resistance near $8,050 on the same chart. Therefore, if the pair clears the triangle resistance and surges above $8,100, there could be solid gains in the coming sessions. The next key resistances area near the $8,200 and $8,300 levels. Above these, the price is likely to trade to a new 2019 high.
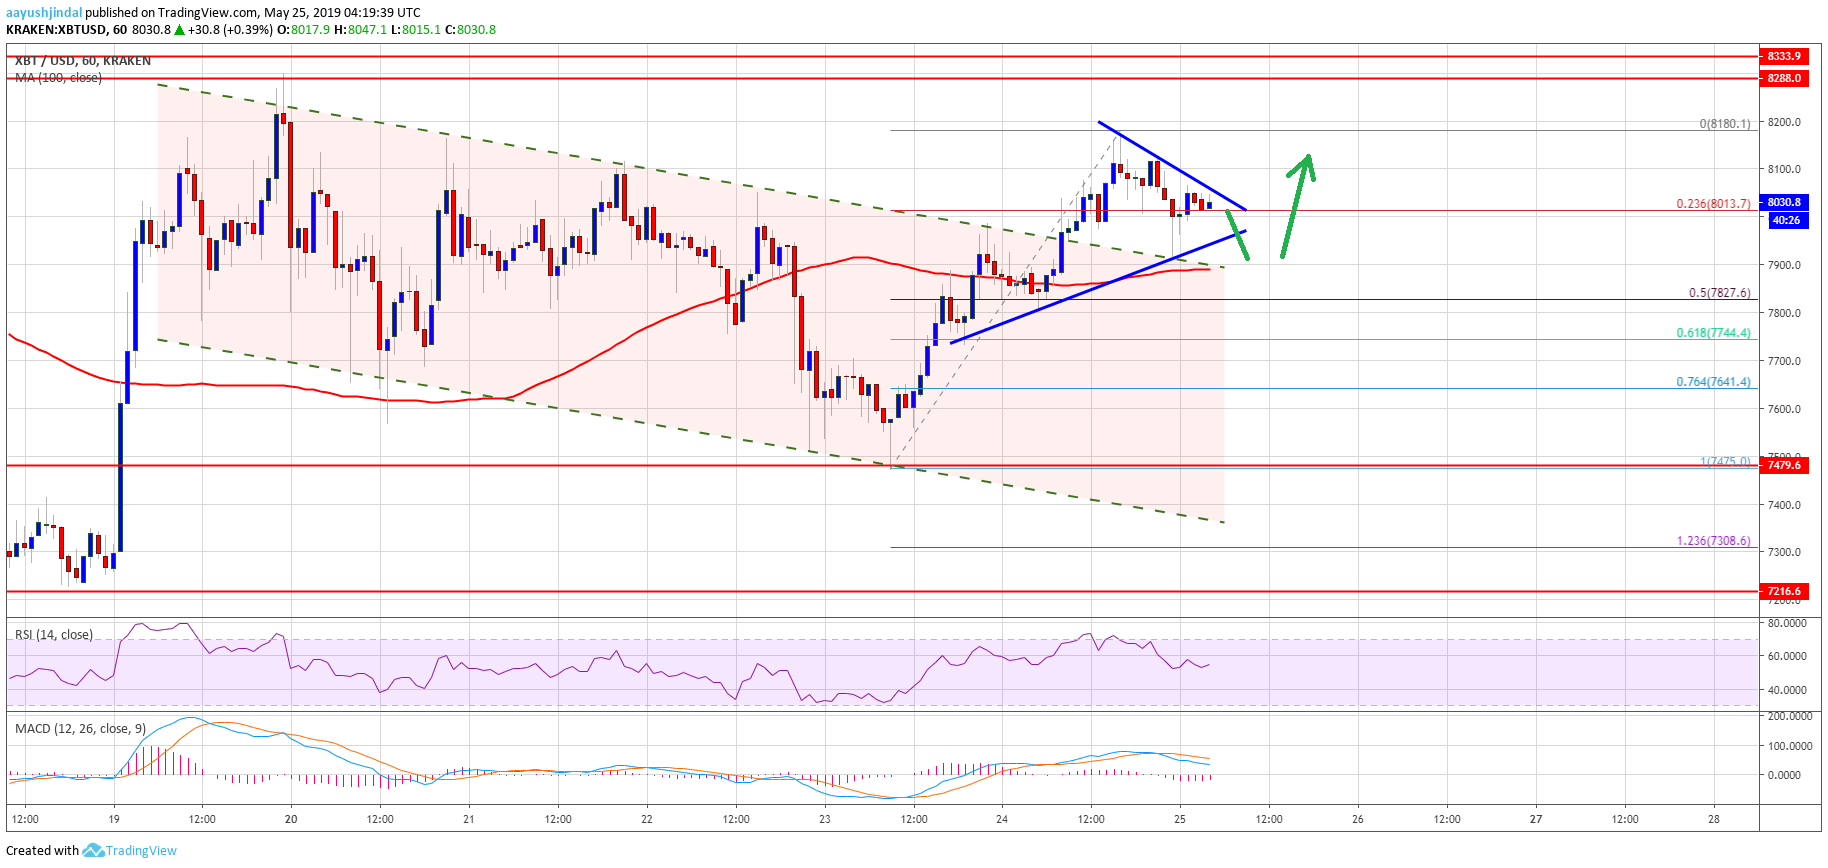
Looking at the chart, bitcoin price clearly jumped back into a positive zone above $7,800. It is currently consolidating gains above the $8,000 level and the 100 hourly SMA. If there is a downside break below the 100 hourly SMA, the price could correct lower towards the $7,710 level. Below $7,710, the next key support is close to the $7,650 level.
Technical indicators:
Hourly MACD – The MACD is currently in the bearish zone, but it could move back in the bullish zone.
Hourly RSI (Relative Strength Index) – The RSI for BTC/USD is holding the main 50 level, with a few positive signs.
Major Support Levels – $7,800 followed by $7,710.
Major Resistance Levels – $8,050, $8,200 and $8,300.
The post Bitcoin (BTC) Price Smashes Resistance: Bulls Target Fresh High appeared first on NewsBTC.
source https://www.tokentalk.co/NewsBTC/bitcoin-btc-price-smashes-resistance-bulls-target-fresh-high-5ce8c630dd04e99b6d0328a3
Saturday, 25 May 2019
Bitcoin (BTC) Price Smashes Resistance: Bulls Target Fresh High @newsbtc #Analysis #Technical #bitcoin #btc
Subscribe to:
Post Comments (Atom)
This analyst says there’s a “high chance” Bitcoin may never fall under $5k again @cryptoslate #Analysis #Price Watch
Once Bitcoin (BTC) started to incur strong losses in the second half of 2019, analysts were once again making extremely low price prediction...

-
The Indian Ministry of Commerce and Industry announced yesterday that the Coffee Board in the country is integrating blockchain into the cof...
-
App-enabled cryptocurrency exchange and wallet provider, Zebpay, has announced that it is enabling Lightning Network payments for all its ...
-
Y... YouTube channel, Capital Creators, performed an experiment offering students the choice of one dollar or one bitcoin. The overwhelmi...


No comments:
Post a Comment