- ETH price started an upside correction above the $172 and $175 resistances against the US Dollar.
- The price even broke the $180 level and it is currently testing the key $185 resistance area.
- The...
- ETH price started an upside correction above the $172 and $175 resistances against the US Dollar.
- The price even broke the $180 level and it is currently testing the key $185 resistance area.
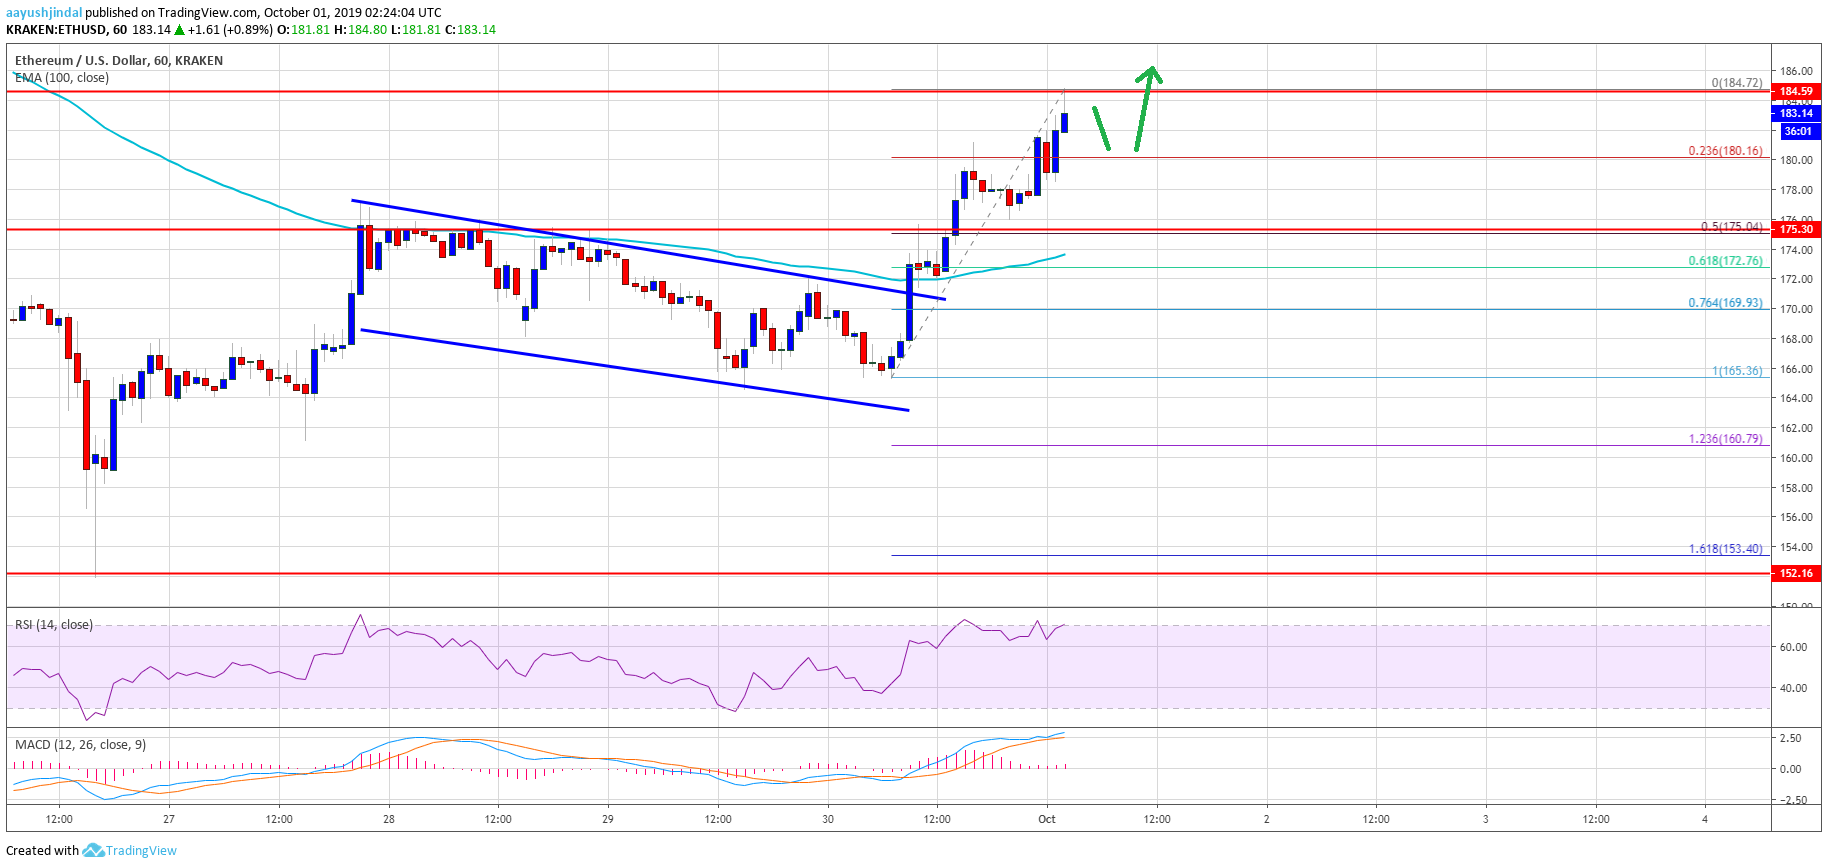
- There was a break above a declining channel with resistance near $171 on the hourly chart of ETH/USD (data feed via Kraken).
- The price could struggle to clear the $185 resistance area in the near term.
Ethereum price is currently rebounding versus the US Dollar, similar to bitcoin. However, ETH price must break the $185 resistance to continue higher in the coming sessions.
Ethereum Price Analysis
Yesterday, we saw a corrective increase in Ethereum above the $170 level against the US Dollar. ETH price faced a strong resistance near the $172 and $175 level. As a result, there was a minor dip before the bulls were able to push the price above the $175 resistance area. Moreover, there was a proper close above the $175 resistance and the 100 hourly simple moving average.
During the rise, there was a break above a declining channel with resistance near $171 on the hourly chart of ETH/USD. The pair even surpassed the $180 level. However, it is now trading near a crucial resistance at $185. The stated $185 level was a major support earlier and it might now prevent further upsides. If there is a clear break above the $185 resistance, Ethereum could continue to rise towards the $200 level.
On the downside, an immediate support is near the $180 level. It represents the 23.6% Fib retracement level of the recent leg from the $165 low to $185 high. However, the main support is now near the $175 level (the recent resistance area). It also coincides with the 50% Fib retracement level of the recent leg from the $165 low to $185 high.
If there are any further losses, the price might find support near the $175 level and the 100 hourly SMA. A successful close below $175 is likely to decrease the chances of more upsides above the $185 resistance area in the near term. The next major support is near the $165 level.
Looking at the chart, Ethereum price is clearly trading near a major resistance area at $185. Therefore, there could be a minor bearish reaction from $185. However, as long as the price is trading above the $175 level and the 100 hourly SMA, there are possibilities of a push towards the $200 level.
ETH Technical Indicators
Hourly MACD – The MACD for ETH/USD is slowly losing momentum in the bullish zone.
Hourly RSI – The RSI for ETH/USD is currently well above the 50 level.
Major Support Level – $175
Major Resistance Level – $185
The post Ethereum (ETH) Price Rebound Reaching Crucial Juncture appeared first on NewsBTC.
source https://www.tokentalk.co/NewsBTC/ethereum-eth-price-rebound-reaching-crucial-juncture-5d92c221e6d37cbf4e6557af
Monday, 30 September 2019
Ethereum (ETH) Price Rebound Reaching Crucial Juncture @newsbtc #Analysis #Technical #ETH #ethereum
Subscribe to:
Post Comments (Atom)
This analyst says there’s a “high chance” Bitcoin may never fall under $5k again @cryptoslate #Analysis #Price Watch
Once Bitcoin (BTC) started to incur strong losses in the second half of 2019, analysts were once again making extremely low price prediction...

-
The Indian Ministry of Commerce and Industry announced yesterday that the Coffee Board in the country is integrating blockchain into the cof...
-
App-enabled cryptocurrency exchange and wallet provider, Zebpay, has announced that it is enabling Lightning Network payments for all its ...
-
Disclaimer: These summaries are provided for educational purposes only by Nelson Rosario and Stephen Palley... Disclaimer: These summaries...

No comments:
Post a Comment