- Bitcoin price settled below the $5,380 and $5,200 support levels against the US Dollar.
- The price is currently under pressure and facing sellers near $5,160 and $5,200.
- There is a short term decl...
- Bitcoin price settled below the $5,380 and $5,200 support levels against the US Dollar.
- The price is currently under pressure and facing sellers near $5,160 and $5,200.
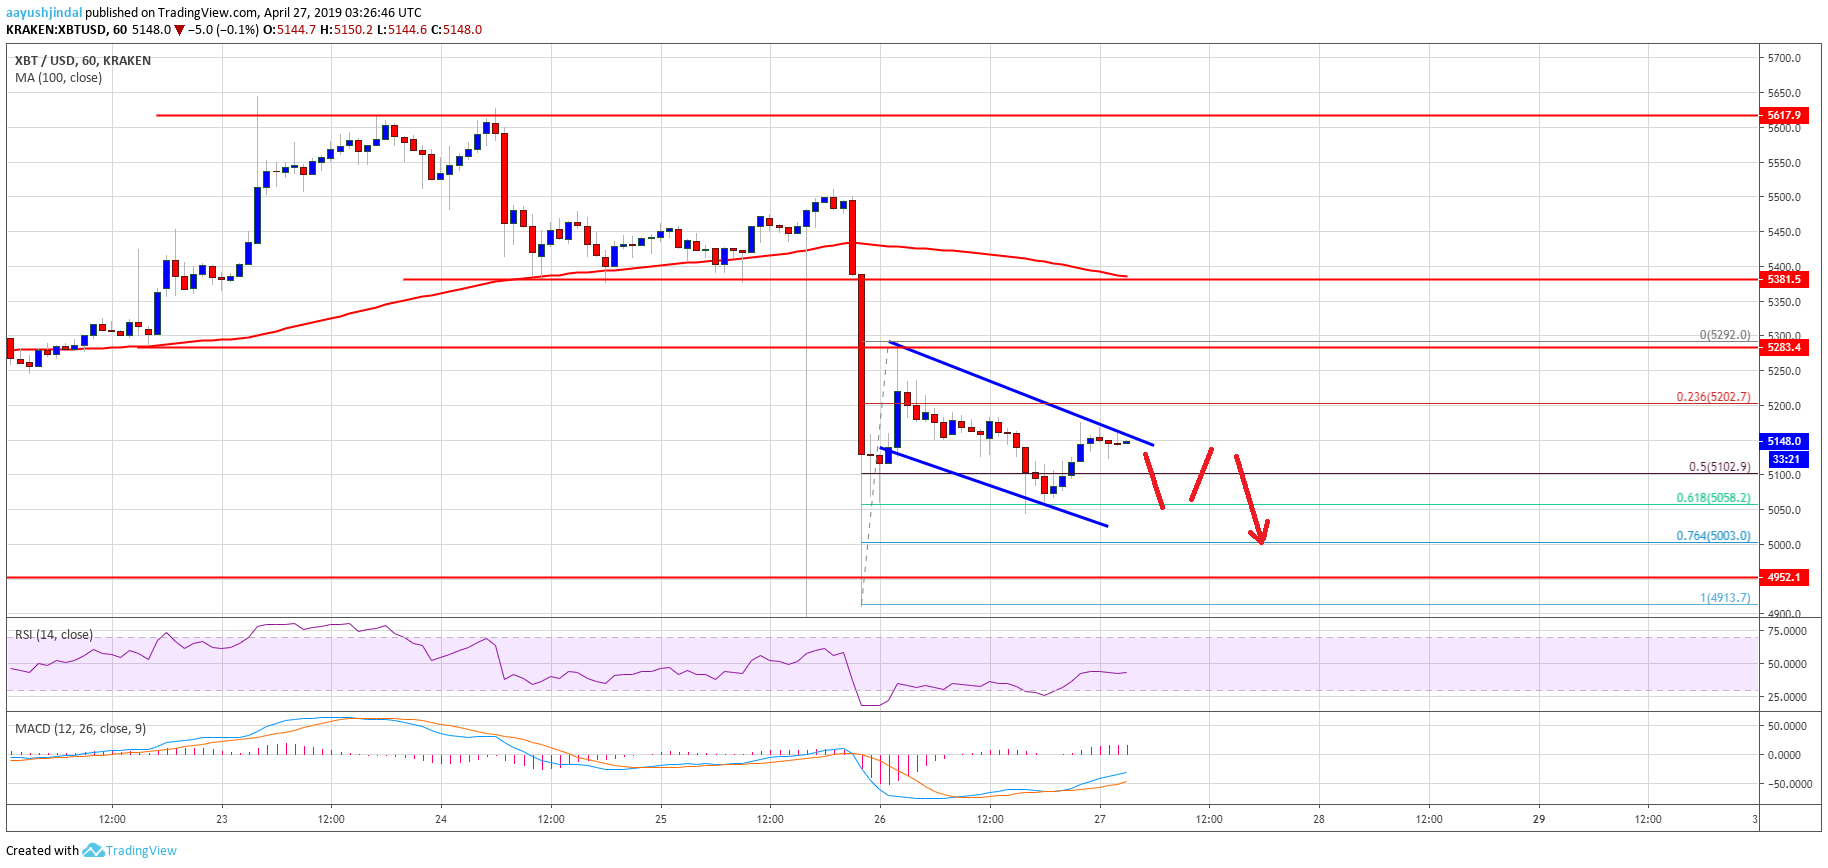
- There is a short term declining channel forming with resistance near $5,160 on the hourly chart of the BTC/USD pair (data feed from Kraken).
- The pair could struggle to move above $5,200 and it may revisit the $5,050 support area.
Bitcoin price dropped heavily after tether’s drama and settled below $5,380 against the US Dollar. BTC could consolidate in the short term before a fresh decrease to $5,000.
Bitcoin Price Analysis
Yesterday, we saw a sharp decline in bitcoin price below the $5,380 and $5,280 supports against the US Dollar. The BTC/USD pair even broke the $5,200 support and spiked below the $5,000 level. A new swing low was formed near $4,912 and recently the price corrected higher. However, the $5,280 and $5,250 levels acted as hurdles, and the price remained well below the 100 hourly simple moving average. After the price failed to clear $5,280, there was a drop below the $5,200 level.
The price declined below the 50% Fib retracement level of the last wave from the $4,913 swing low to $5,292 high. However, the $5,050 support prevented additional losses and the price recovered recently. Besides, the 61.8% Fib retracement level of the last wave from the $4,913 swing low to $5,292 high acted as a support. At the moment, the price is correcting higher, but facing a lot of hurdles near $5,160, $5,180 and $5,200. There is also a short term declining channel forming with resistance near $5,160 on the hourly chart of the BTC/USD pair.
If there is an upside break above $5,160, the price could test the $5,200 resistance. However, the price must move above the $5,250 and $5,280 levels to start a strong upward move. If it continues to struggle near $5,280, there is a risk of another dip below $5,120 and $5,100 in the near term. The next key support is at $5,050, below which there is a risk of a drop below the $5,000 support.
Looking at the chart, bitcoin price is under a lot of pressure below the $5,280 resistance level. If the bears remain in action for a long time, there is a risk of a sharp decline below the $5,050 and $5,000 support levels. On the upside, a close above $5,280 might push the price towards $5,380.
Technical indicators:
Hourly MACD – The MACD is currently in the bullish zone, with a few negative signs.
Hourly RSI (Relative Strength Index) – The RSI for BTC/USD is currently moving higher towards the 50 level.
Major Support Levels – $5,100 followed by $5,050.
Major Resistance Levels – $5,160, $5,200 and $5,280.
The post Bitcoin (BTC) Price Showing Signs of Weakness, Sell Rallies? appeared first on NewsBTC.
source https://www.tokentalk.co/NewsBTC/bitcoin-btc-price-showing-signs-of-weakness-sell-rallies-5cc3d5a162fbeeea2c09569b
Friday, 26 April 2019
Bitcoin (BTC) Price Showing Signs of Weakness, Sell Rallies? @newsbtc #Analysis #Technical #bitcoin #btc
Subscribe to:
Post Comments (Atom)
This analyst says there’s a “high chance” Bitcoin may never fall under $5k again @cryptoslate #Analysis #Price Watch
Once Bitcoin (BTC) started to incur strong losses in the second half of 2019, analysts were once again making extremely low price prediction...

-
The Indian Ministry of Commerce and Industry announced yesterday that the Coffee Board in the country is integrating blockchain into the cof...
-
App-enabled cryptocurrency exchange and wallet provider, Zebpay, has announced that it is enabling Lightning Network payments for all its ...
-
Once Bitcoin (BTC) started to incur strong losses in the second half of 2019, analysts were once again making extremely low price prediction...


No comments:
Post a Comment