- ETH price corrected higher recently but failed to break the $160 resistance against the US Dollar.
- The price is currently moving lower and it might revisit the $150 or even $146 support level.
- Th...
- ETH price corrected higher recently but failed to break the $160 resistance against the US Dollar.
- The price is currently moving lower and it might revisit the $150 or even $146 support level.
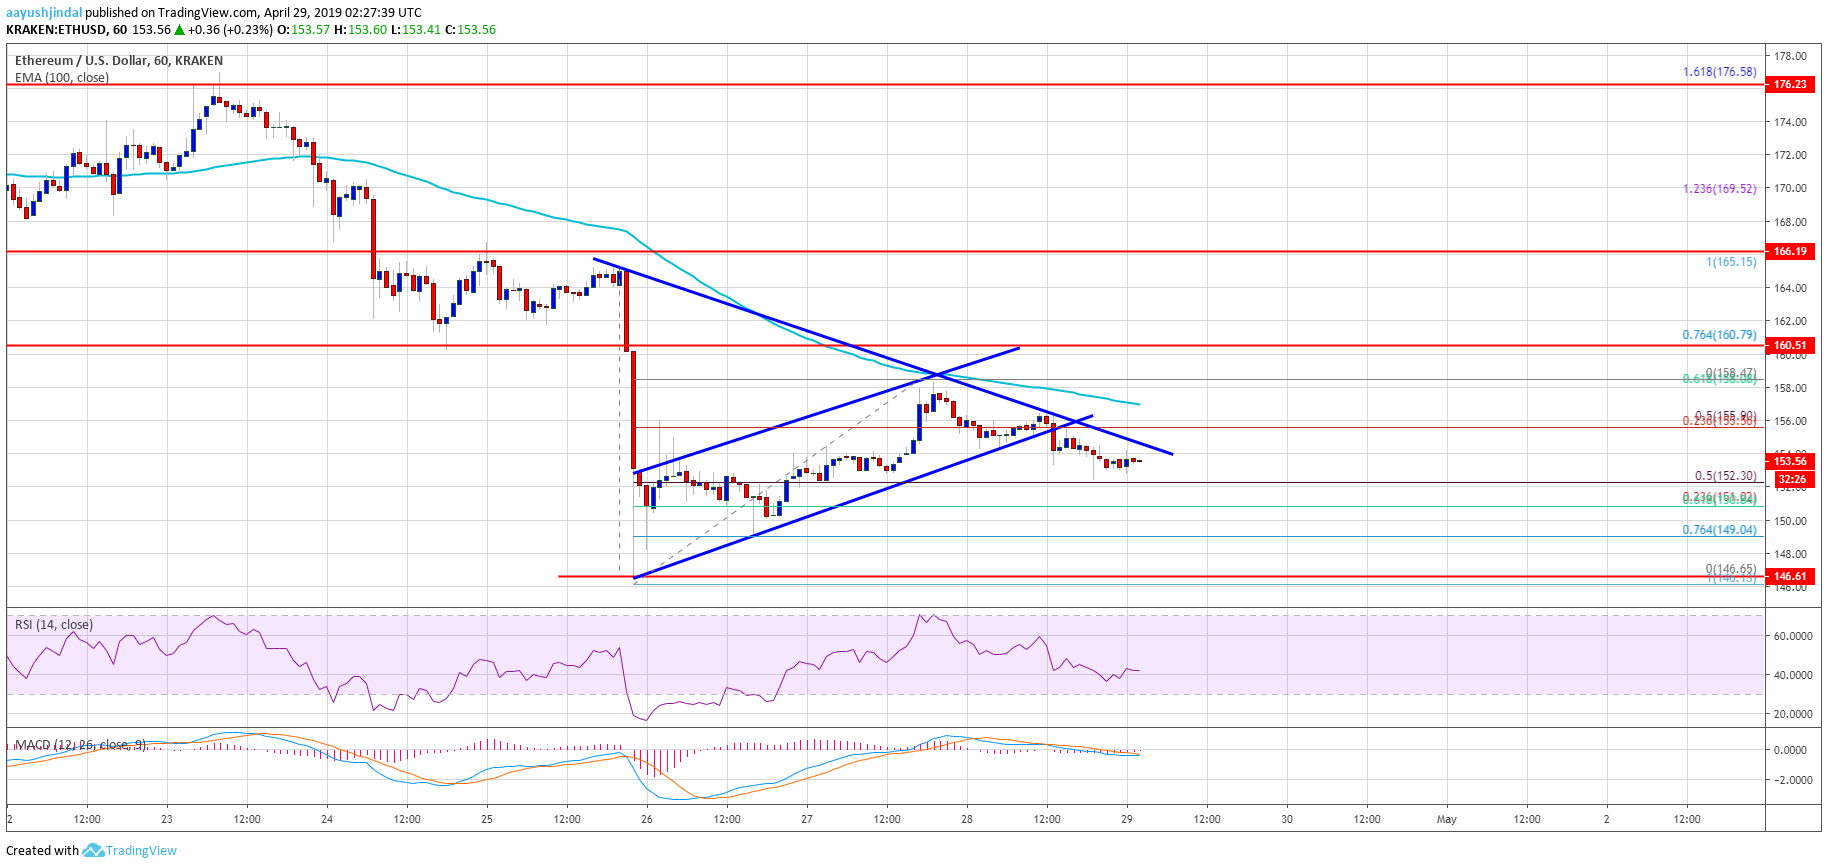
- There is a key connecting bearish trend line formed with resistance at $155 on the hourly chart of ETH/USD (data feed via Kraken).
- The pair could recover if it surpasses the $156 resistance and the 100 hourly simple moving average.
Ethereum price is facing an increase in selling pressure versus the US Dollar and bitcoin. ETH remained capped below $160 and it is now declining towards the $150 support.
Ethereum Price Analysis
After a strong decline below $150, Ethereum price started a short term upside correction against the US Dollar. The ETH/USD pair gained traction above the $154 and $155 resistance levels. The pair climbed towards the $160 level, but it struggled a lot near the $158 level and the 100 hourly simple moving average. The price topped below the $159 level and recently started a fresh decline. It broke the $155 and $154 support levels.
There was a break below the 23.6% Fib retracement level of the recent wave from the $146 swing low to $149 swing high. Moreover, there was a break below an ascending channel with support at $155 on the hourly chart of ETH/USD. The pair tested the 50% Fib retracement level of the recent wave from the $146 swing low to $149 swing high. On the downside, a break below the $152 level may open the doors for more losses below the $150 support level. The next key support is at $146, below which the price may test $142.
On the upside, there is a key connecting bearish trend line formed with resistance at $155 on the same chart. Above the trend line, the main resistance is near $156 and the 100 hourly SMA. A convincing break above the $156 resistance may push the price towards the $160 resistance level. If buyers gain control above $160, the price could stage a decent comeback above the $166 level.
Looking at the chart, Ethereum price is clearly facing a lot of hurdles near the $155 and $156 levels. If there is a successful close above the $156 level and the 100 hourly SMA, the bears may step back in the short term. If not, there is a risk of a sharp decline towards the $146 or $142 level.
ETH Technical Indicators
Hourly MACD – The MACD for ETH/USD is slowly moving back in the bearish zone.
Hourly RSI – The RSI for ETH/USD is currently rebounding higher towards the 45 and 50 levels.
Major Support Level – $150
Major Resistance Level – $156
The post Ethereum (ETH) Price In Another Decrease As Bulls Struggle appeared first on NewsBTC.
source https://www.tokentalk.co/NewsBTC/ethereum-eth-price-in-another-decrease-as-bulls-struggle-5cc678a1b8ce0e646c2c3625
Sunday, 28 April 2019
Ethereum (ETH) Price In Another Decrease As Bulls Struggle @newsbtc #Analysis #Technical #ETH #ethereum
Subscribe to:
Post Comments (Atom)
This analyst says there’s a “high chance” Bitcoin may never fall under $5k again @cryptoslate #Analysis #Price Watch
Once Bitcoin (BTC) started to incur strong losses in the second half of 2019, analysts were once again making extremely low price prediction...

-
The Indian Ministry of Commerce and Industry announced yesterday that the Coffee Board in the country is integrating blockchain into the cof...
-
App-enabled cryptocurrency exchange and wallet provider, Zebpay, has announced that it is enabling Lightning Network payments for all its ...
-
Disclaimer: These summaries are provided for educational purposes only by Nelson Rosario and Stephen Palley... Disclaimer: These summaries...

No comments:
Post a Comment