- Ripple price recovered recently above the $0.2900 level and tested $0.2960 against the US dollar.
- The price seems to be facing a strong resistance near the $0.2950 and $0.2960 resistance levels.
- ...
- Ripple price recovered recently above the $0.2900 level and tested $0.2960 against the US dollar.
- The price seems to be facing a strong resistance near the $0.2950 and $0.2960 resistance levels.
- There is a connecting bearish trend line forming with resistance near $0.2935 on the hourly chart of the XRP/USD pair (data source from Kraken).
- The pair could revisit the $0.2810 level as long as it is trading below $0.2960 and $0.3000.
Ripple price is facing a lot of hurdles on the upside against the US Dollar and bitcoin. XRP remains at a risk of more declines unless it climbs back above the $0.3000 resistance area.
Ripple Price Analysis
After a short term correction, ripple price extended losses below the $0.2950 support against the US Dollar. The XRP/USD pair broke the $0.2920 support level and declined heavily below $0.2900. It traded close to the $0.2800 level and settled well below the 100 hourly simple moving average. A new monthly low was formed at $0.2796 and the price recently corrected higher. It broke the $0.2860 level and the 23.6% Fib retracement level of the last drop from the $0.3077 high to $0.2796 low.
The price even moved above the $0.2900 level, but it faced a strong resistance near the $0.2950 and $0.2960 resistance levels. More importantly, the price failed to clear the 100 hourly simple moving average, which is currently near $0.2938. Besides, the price failed near the 50% Fib retracement level of the last drop from the $0.3077 high to $0.2796 low. Finally, there is also a connecting bearish trend line forming with resistance near $0.2935 on the hourly chart of the XRP/USD pair.
Therefore, ripple must break the $0.2950 resistance, the trend line, and the 100 hourly SMA. A successful close above the $0.2950-0.2960 zone could push the price towards the next resistance at $0.3000. Once there is a daily close above $0.3000, the price may start a decent recovery in the near term. On the downside, an initial support is near the $0.2860 level. If the bulls struggle to keep the price above $0.2860, the price could revisit the $0.2810 and $0.2800 support levels.
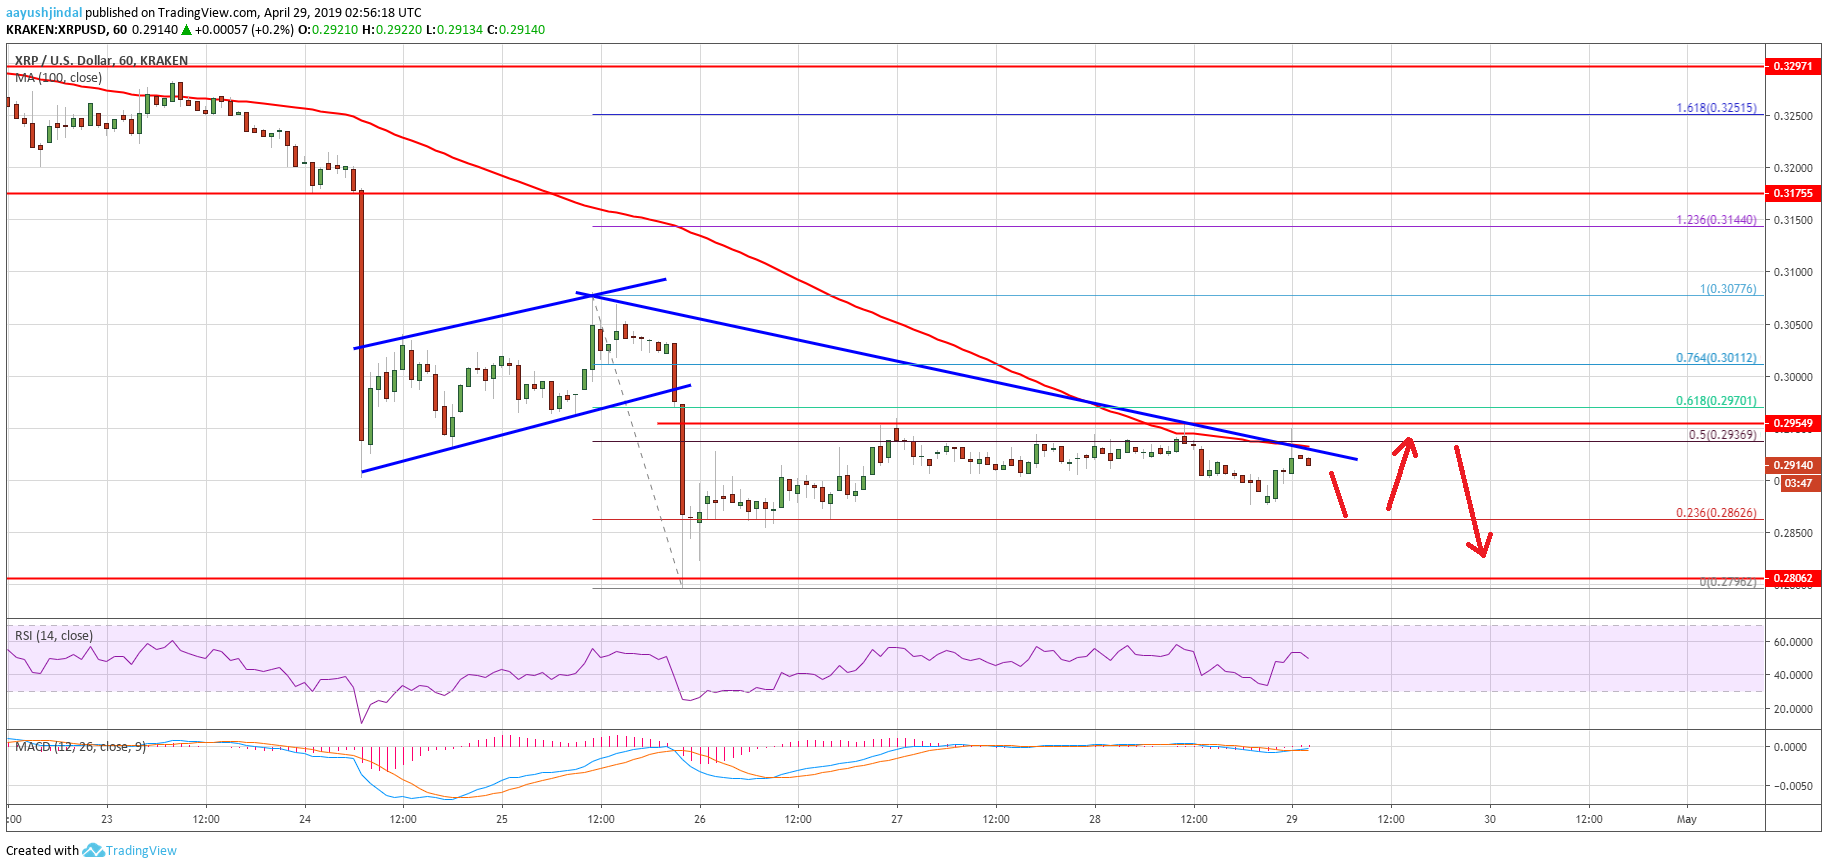
Looking at the chart, ripple price is clearly trading in a tight range below key resistances near $0.2960 and $0.3000. The bulls need to gain traction above $0.3000 to push the price back in a positive zone. If not, there is a risk of a fresh decline towards the $0.2810 or $0.2750 level.
Technical Indicators
Hourly MACD – The MACD for XRP/USD is likely to remain in the bearish zone.
Hourly RSI (Relative Strength Index) – The RSI for XRP/USD recently jumped above the 50 level.
Major Support Levels – $0.2860, $0.2810 and $0.2800.
Major Resistance Levels – $0.2950, $0.2960 and $0.3000.
The post Ripple (XRP) Price Remains At Risk Of Further Decline appeared first on NewsBTC.
source https://www.tokentalk.co/NewsBTC/ripple-xrp-price-remains-at-risk-of-further-decline-5cc684d0b8ce0e646c2c362d
Sunday, 28 April 2019
Ripple (XRP) Price Remains At Risk Of Further Decline @newsbtc #Analysis #Technical #Ripple #xrp
Subscribe to:
Post Comments (Atom)
This analyst says there’s a “high chance” Bitcoin may never fall under $5k again @cryptoslate #Analysis #Price Watch
Once Bitcoin (BTC) started to incur strong losses in the second half of 2019, analysts were once again making extremely low price prediction...

-
The Indian Ministry of Commerce and Industry announced yesterday that the Coffee Board in the country is integrating blockchain into the cof...
-
App-enabled cryptocurrency exchange and wallet provider, Zebpay, has announced that it is enabling Lightning Network payments for all its ...
-
Disclaimer: These summaries are provided for educational purposes only by Nelson Rosario and Stephen Palley... Disclaimer: These summaries...

No comments:
Post a Comment