- Bitcoin price extended its rally and climbed above the $10,500 and $10,650 resistances against the US Dollar.
- The price is currently correcting lower after trading to a new monthly high at $10,790.
- <...
- Bitcoin price extended its rally and climbed above the $10,500 and $10,650 resistances against the US Dollar.
- The price is currently correcting lower after trading to a new monthly high at $10,790.
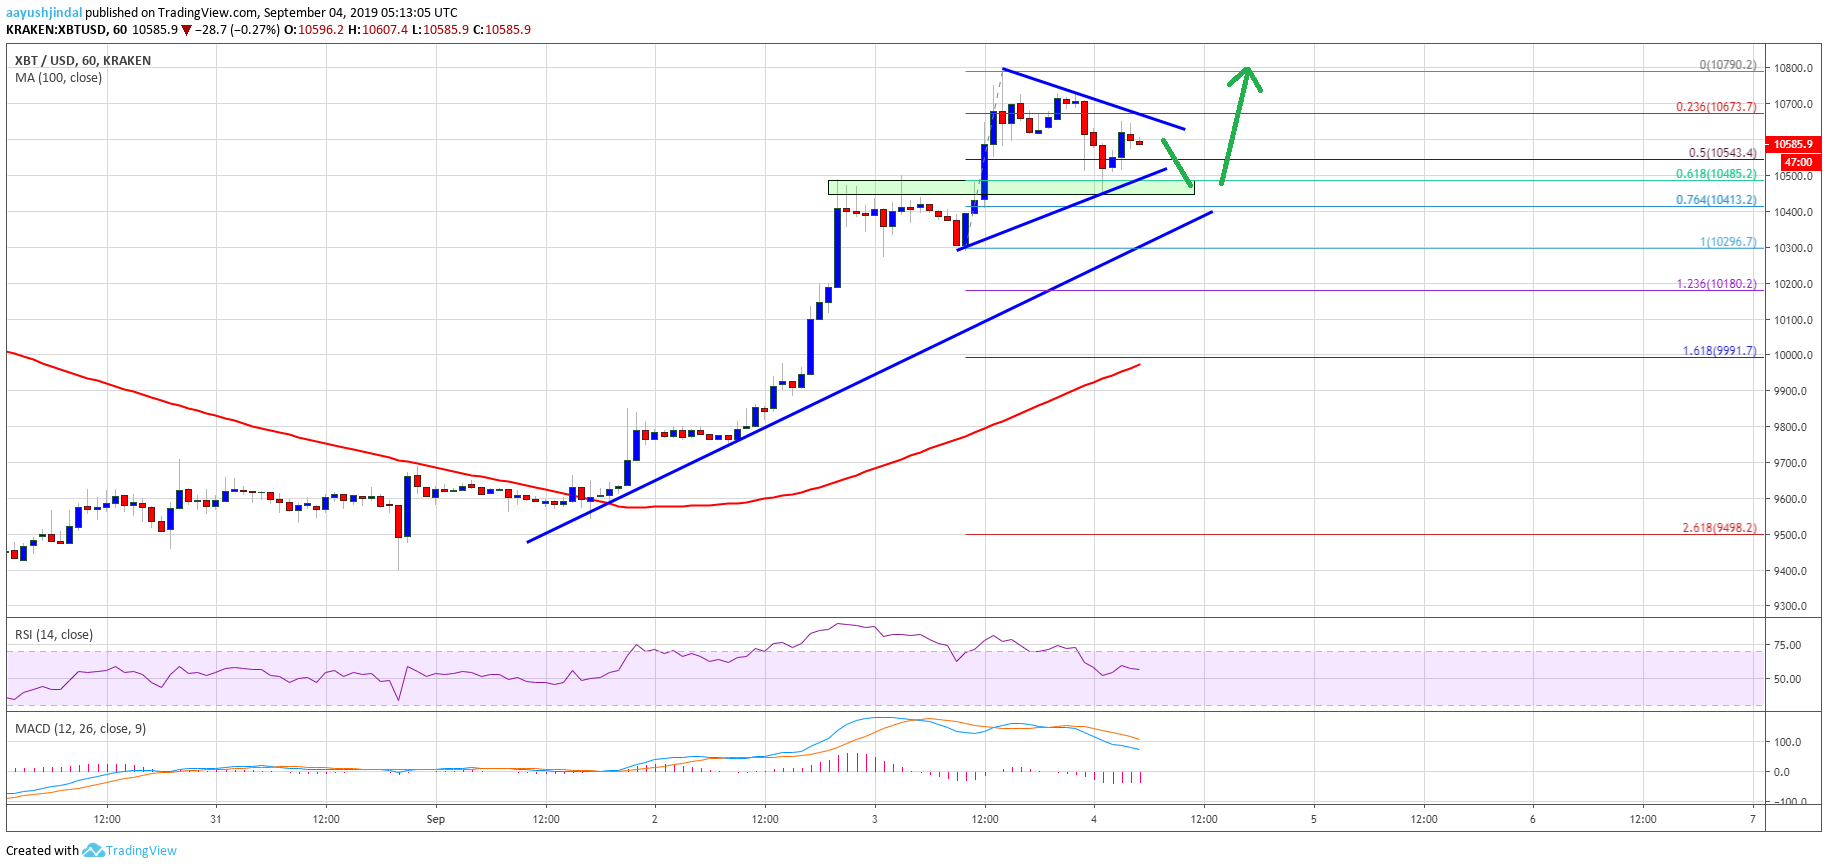
- There is a major bullish trend line forming with support near $10,400 on the hourly chart of the BTC/USD pair (data feed from Kraken).
- The price is showing positive signs and it remains well bid near $10,500 and $10,400.
Bitcoin price is gaining bullish momentum above $10,500 against the US Dollar. BTC might correct lower, but it is likely to bounce back from the $10,400 support.
Bitcoin Price Analysis
Yesterday, we saw a nice upward move in BTC, Ethereum and ripple against the US Dollar. The bulls gained traction and pushed bitcoin above the $10,400 and $10,500 resistance levels. Moreover, there was a close above the $10,500 resistance and the 100 hourly simple moving average. It opened the doors for more gains and the price climbed above the $10,650 resistance.
Finally, a new monthly high was formed near $10,790 and the price is currently correcting lower. It broke the $10,650 level plus the 23.6% Fib retracement level of the upward move from the $10,296 low to $10,790 high. However, the decline found support near the $10,450 level. Additionally, there is a major bullish trend line forming with support near $10,400 on the hourly chart of the BTC/USD pair.
Bitcoin stayed well above the 61.8% Fib retracement level of the upward move from the $10,296 low to $10,790 high. At the moment, there is a contracting triangle forming with support near $10,450 on the same chart. In the short term, the price could decline towards the $10,450 and $10,400 support levels. As long as the price is above $10,400, there could be another rise towards the $10,800 resistance level.
Conversely, if the price fails to stay above the $10,400 support, it could extend its correction. The next key support is near the $10,200 level, plus the 1.236 Fib extension level of the upward move from the $10,296 low to $10,790 high. The main support is near the $10,000 level, which is also close to the 100 hourly simple moving average.
Looking at the chart, bitcoin price is trading with a positive bias above the $10,450 and $10,400 support levels. Even if there is an extended downside correction, the $10,200 level might act prevent declines. On the upside, the next set of resistance is near the $10,800 and $11,000 levels.
Technical indicators:
Hourly MACD – The MACD is currently placed in the bearish zone.
Hourly RSI (Relative Strength Index) – The RSI for BTC/USD is holding the 50 level, with a minor bearish angle.
Major Support Levels – $10,450 followed by $10,400.
Major Resistance Levels – $10,700, $10,800 and $11,000.
The post Bitcoin Price (BTC) Surging, Dips Remains Well Supported appeared first on NewsBTC.
source https://www.tokentalk.co/NewsBTC/bitcoin-price-btc-surging-dips-remains-well-supported-5d6f51f1b98396a4770c979a
Tuesday, 3 September 2019
Bitcoin Price (BTC) Surging, Dips Remains Well Supported @newsbtc #Analysis #Technical #bitcoin #btc
Subscribe to:
Post Comments (Atom)
This analyst says there’s a “high chance” Bitcoin may never fall under $5k again @cryptoslate #Analysis #Price Watch
Once Bitcoin (BTC) started to incur strong losses in the second half of 2019, analysts were once again making extremely low price prediction...

-
The Indian Ministry of Commerce and Industry announced yesterday that the Coffee Board in the country is integrating blockchain into the cof...
-
App-enabled cryptocurrency exchange and wallet provider, Zebpay, has announced that it is enabling Lightning Network payments for all its ...
-
Once Bitcoin (BTC) started to incur strong losses in the second half of 2019, analysts were once again making extremely low price prediction...


No comments:
Post a Comment