- ETH price is currently correcting higher and is trading above $170 against the US Dollar.
- The price is likely to face a lot of hurdles on the upside near the $176, $178 and $180 levels.
- There is ...
- ETH price is currently correcting higher and is trading above $170 against the US Dollar.
- The price is likely to face a lot of hurdles on the upside near the $176, $178 and $180 levels.
- There is a connecting bullish trend line forming with support near $168 on the hourly chart of ETH/USD (data feed via Kraken).
- The pair might gain bullish momentum if it breaks the $174 level and the 100 hourly SMA.
Ethereum price is slowly correcting higher versus the US Dollar, similar to bitcoin. However, ETH price is likely to fail near the key $180 resistance area in the near term.
Ethereum Price Analysis
This past week, we saw a major decline in ETH price below the $180 support against the US Dollar. Moreover, there was a close below the $175 level and the 100 hourly simple moving average. Finally, the price traded to a new monthly low at $163. Later, the price started consolidating losses and it seems like a decent support base is forming near the $165 level.
Recently, Ethereum price started an upside correction above the $168 level. Moreover, there was a break above the 23.6% Fib retracement level of the downward move from the $188 high to $163 swing low. However, it seems like the price is struggling to surpass the 100 hourly simple moving average, currently at $172. If there is a break above the 100 hourly simple moving average, the price could recover towards $175.
The 50% Fib retracement level of the downward move from the $188 high to $163 swing low is positioned near the $175 level to act as a resistance. However, the main resistance on the upside is near the $180 level (the previous support area). A successful close above $180 is needed for a decent recovery in the coming sessions.
On the downside, an initial support is near the $168 level. Additionally, there is a connecting bullish trend line forming with support near $168 on the hourly chart of ETH/USD. If the pair breaks the $168 support, it could retest the key $165 support area. If there are more downsides below $165, the price could even break the $163 swing low and trade to a new low.
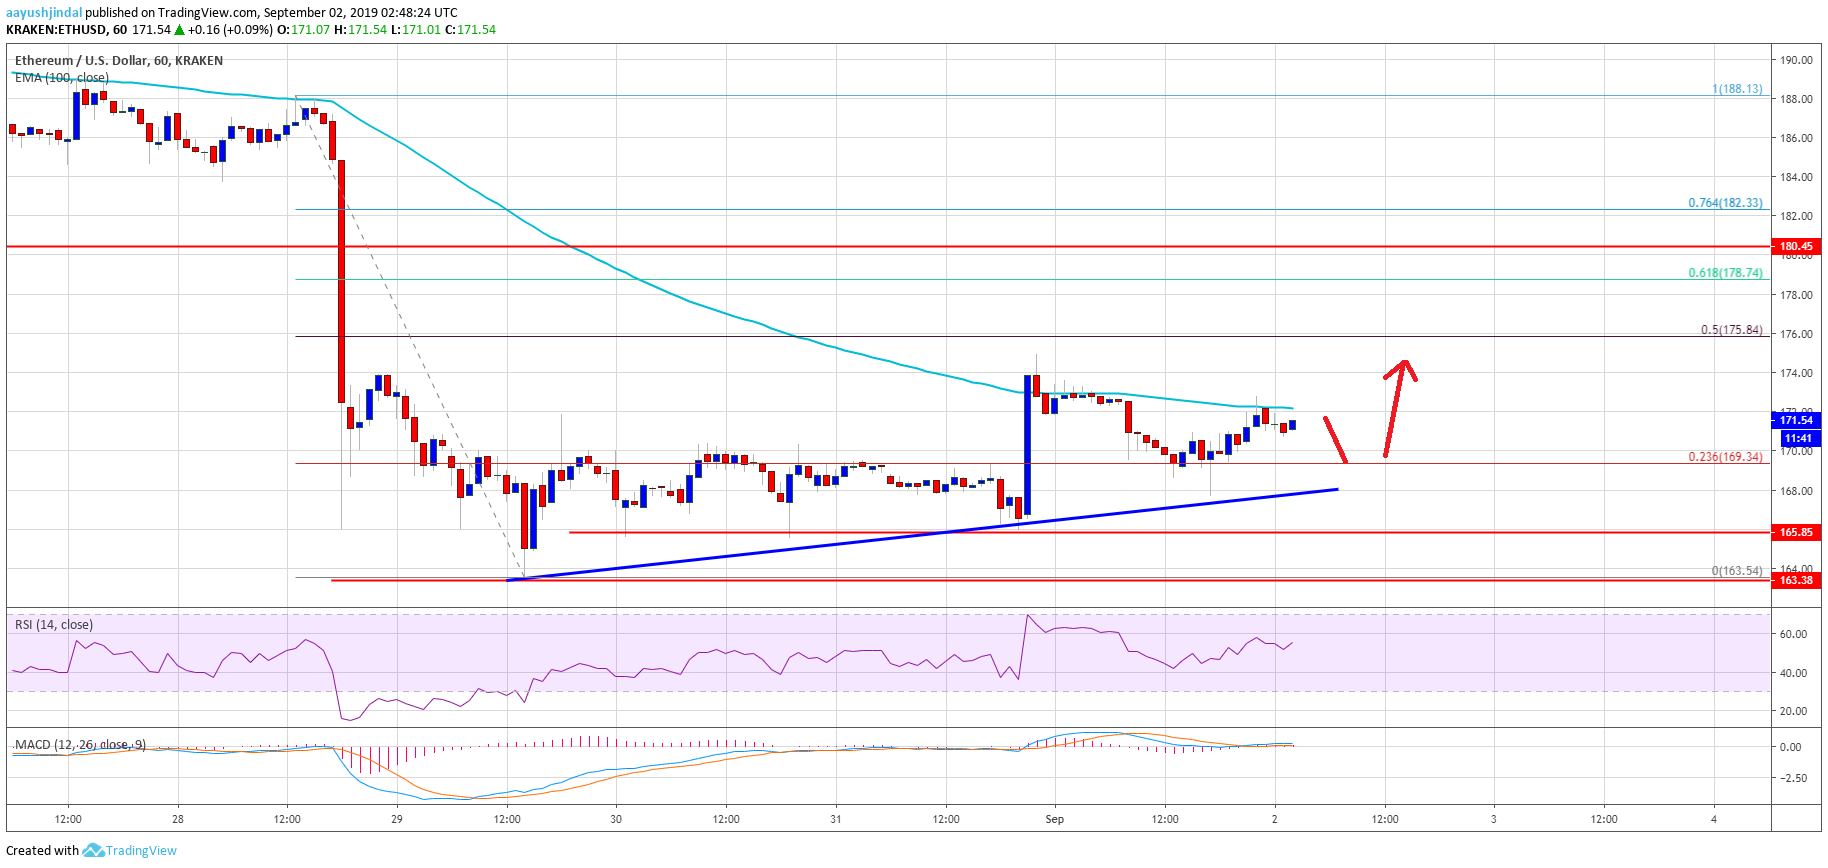
Looking at the chart, Ethereum price might gain bullish momentum if it breaks the $174 level and the 100 hourly SMA. However, it won’t be easy for the bulls to clear the $178-180 resistance area.
ETH Technical Indicators
Hourly MACD – The MACD for ETH/USD is slowly moving into the bullish zone.
Hourly RSI – The RSI for ETH/USD is currently above the 50 level, with a few positive signs.
Major Support Level – $165
Major Resistance Level – $175
The post Ethereum Price (ETH) In Corrective Increase, Can It Break $180? appeared first on NewsBTC.
source https://www.tokentalk.co/NewsBTC/ethereum-price-eth-in-corrective-increase-can-it-break-180-5d6c86a1b98396a4770c96fe
Sunday, 1 September 2019
Ethereum Price (ETH) In Corrective Increase, Can It Break $180? @newsbtc #Analysis #Technical #ETH #ethereum
Subscribe to:
Post Comments (Atom)
This analyst says there’s a “high chance” Bitcoin may never fall under $5k again @cryptoslate #Analysis #Price Watch
Once Bitcoin (BTC) started to incur strong losses in the second half of 2019, analysts were once again making extremely low price prediction...

-
The Indian Ministry of Commerce and Industry announced yesterday that the Coffee Board in the country is integrating blockchain into the cof...
-
App-enabled cryptocurrency exchange and wallet provider, Zebpay, has announced that it is enabling Lightning Network payments for all its ...
-
Once Bitcoin (BTC) started to incur strong losses in the second half of 2019, analysts were once again making extremely low price prediction...


No comments:
Post a Comment