- ETH price declined heavily and broke the key $185 and $180 supports against the US Dollar.
- The price is currently correcting higher and is trading near the $172 and $175 resistances.
- There is a m...
- ETH price declined heavily and broke the key $185 and $180 supports against the US Dollar.
- The price is currently correcting higher and is trading near the $172 and $175 resistances.
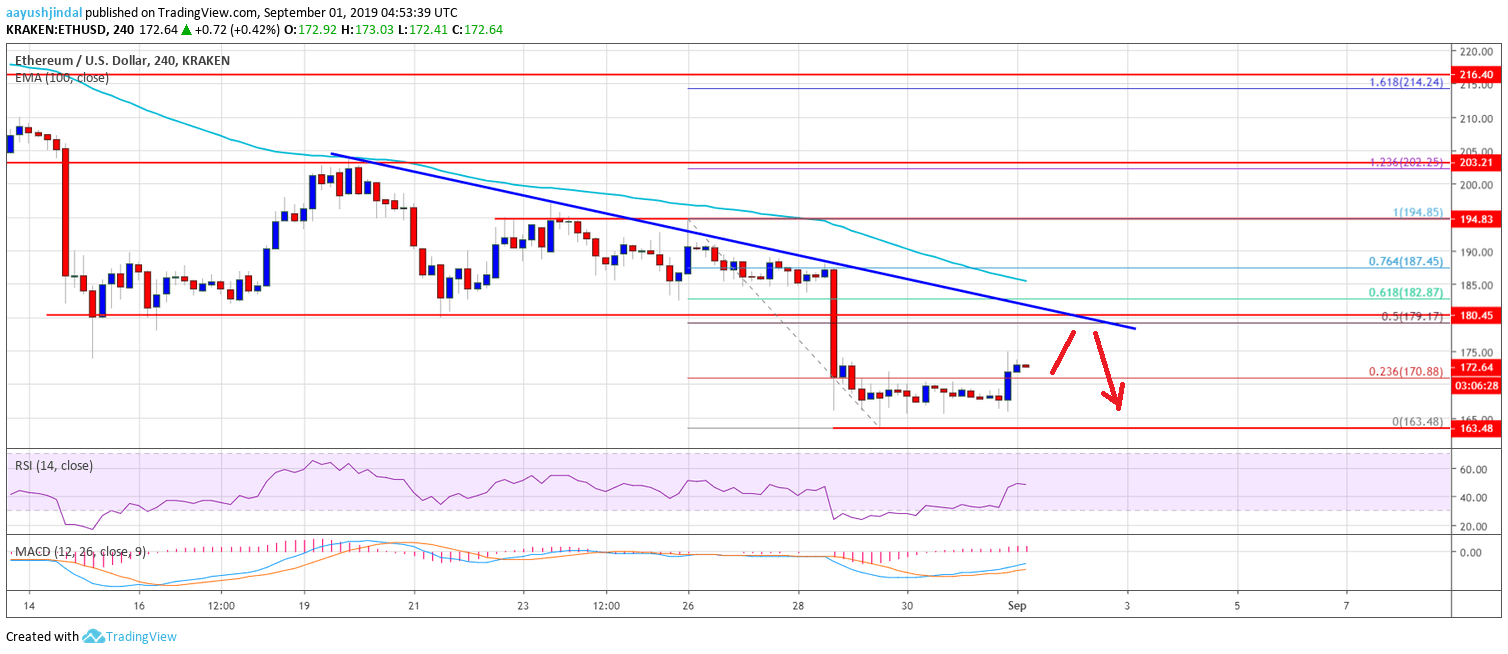
- There is a major bearish trend line forming with resistance near $180 on the 4-hours chart of ETH/USD (data feed via Kraken).
- There could be a short term upside correction, but upsides are likely to be capped near $180.
Ethereum price is trading in a bearish zone against the US Dollar and bitcoin. ETH might correct higher in the short-term, but the bulls are likely to struggle near $180-$182.
Ethereum Price Weekly Analysis
This past week, there was a strong decline in bitcoin and ETH below $10,000 and $180 respectively against the US Dollar. Ether price even declined below the $175 support and the 100 simple moving average (4-hours). Moreover, there was a break below the $170 support and the price traded close to the $163 level. Recently, the price started an upside correction from the $163 swing low.
It climbed above the $170 level plus the 23.6% Fib retracement level of the recent drop from the $195 high to $163 swing low. However, there are many hurdles on the upside near the $178 and $180 levels. Moreover, there is a major bearish trend line forming with resistance near $180 on the 4-hours chart of ETH/USD. The trend line is close to the 50% Fib retracement level of the recent drop from the $195 high to $163 swing low.
Above the trend line, the next major resistance is near the $184 level and the 100 SMA. The 61.8% Fib retracement level of the recent drop from the $195 high to $163 swing low is also waiting near the $182 zone to act as a resistance. Therefore, the price must climb above $180, $182 and $184 to move back into a positive zone in the near term.
On the downside, an immediate support is near the $165 level. If the price fails to stay above the $165 support area, there is a risk of more downsides in the near term. In the mentioned bearish case, the price could even decline below the $160 support level.
The above chart indicates that Ethereum price is clearly trading in a bearish zone below the $180 level. If there is an upside correction towards the $180 level, the bears are likely to defend further upsides.
Technical Indicators
4 hours MACD – The MACD for ETH/USD is slowly gaining momentum in the bullish zone.
4 hours RSI – The RSI for ETH/USD is currently just above the 50 level, with a positive angle.
Major Support Level – $165
Major Resistance Level – $180
The post Ethereum Price Weekly Forecast: ETH Remain Sell Until This Changes appeared first on NewsBTC.
source https://www.tokentalk.co/NewsBTC/ethereum-price-weekly-forecast-eth-remain-sell-until-this-changes-5d6b5d71b98396a4770c96e8
Sunday, 1 September 2019
Ethereum Price Weekly Forecast: ETH Remain Sell Until This Changes @newsbtc #Analysis #Technical #ETH #ethereum
Subscribe to:
Post Comments (Atom)
This analyst says there’s a “high chance” Bitcoin may never fall under $5k again @cryptoslate #Analysis #Price Watch
Once Bitcoin (BTC) started to incur strong losses in the second half of 2019, analysts were once again making extremely low price prediction...

-
The Indian Ministry of Commerce and Industry announced yesterday that the Coffee Board in the country is integrating blockchain into the cof...
-
App-enabled cryptocurrency exchange and wallet provider, Zebpay, has announced that it is enabling Lightning Network payments for all its ...
-
Once Bitcoin (BTC) started to incur strong losses in the second half of 2019, analysts were once again making extremely low price prediction...


No comments:
Post a Comment