- Ripple price is trading in a downtrend below the $0.2600 and $0.2650 supports against the US dollar.
- The price is likely to extend its decline as long as it is below the $0.2650 level.
- There is a...
- Ripple price is trading in a downtrend below the $0.2600 and $0.2650 supports against the US dollar.
- The price is likely to extend its decline as long as it is below the $0.2650 level.
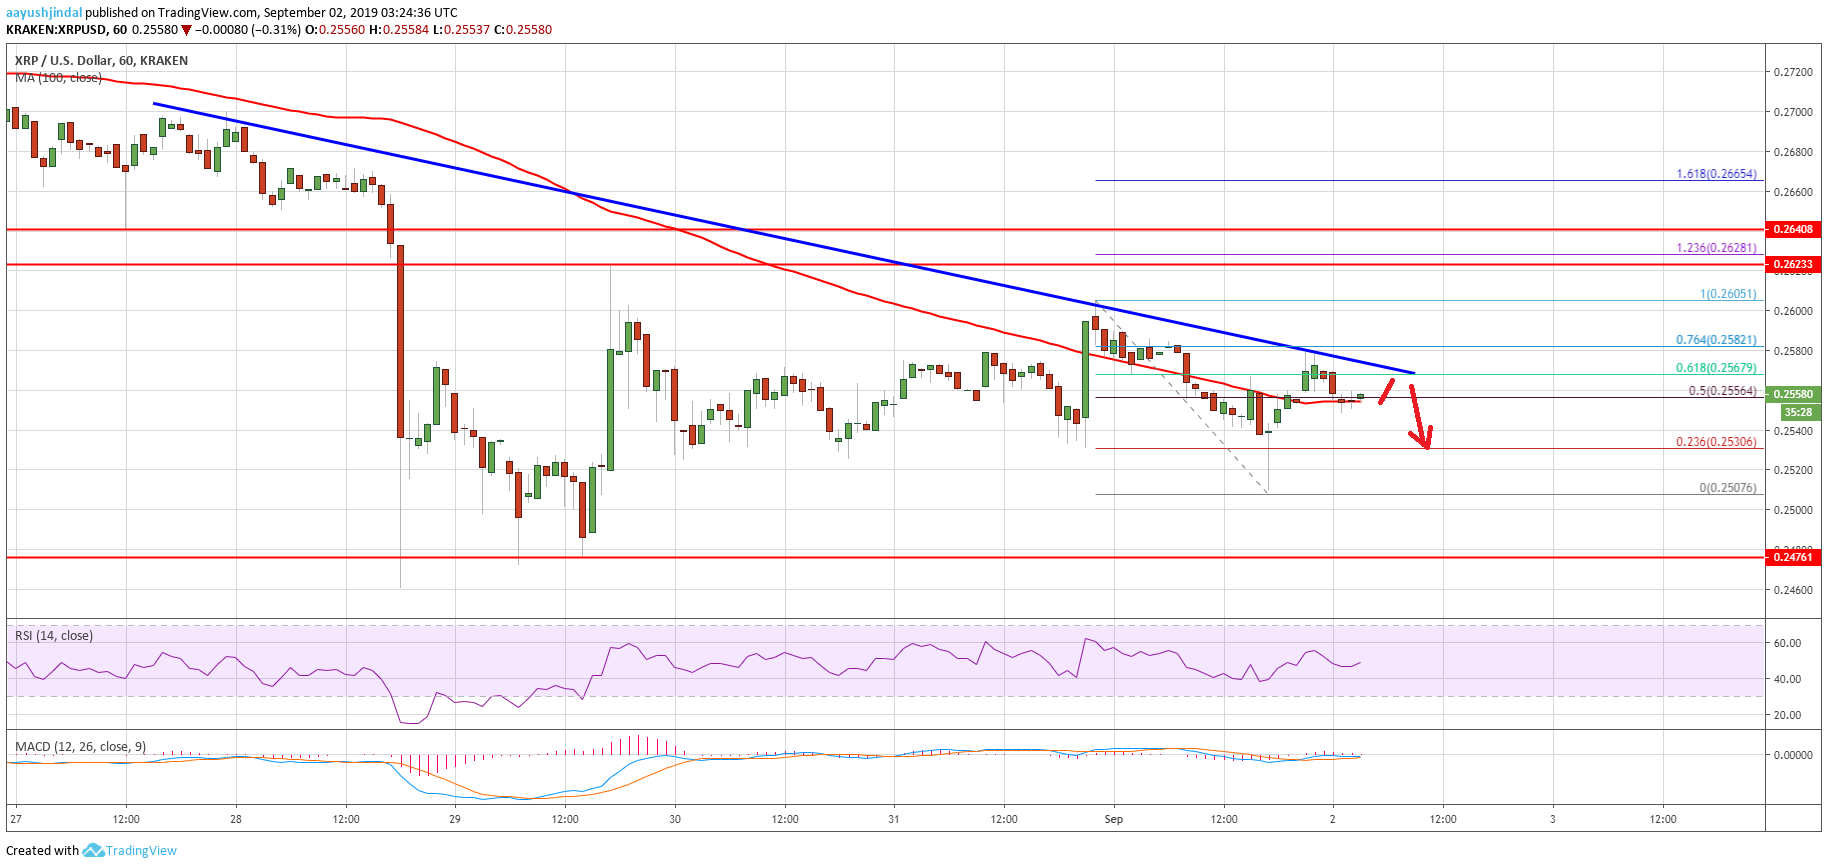
- There is a key bearish trend line forming with resistance near $0.2570 on the hourly chart of the XRP/USD pair (data source from Kraken).
- There could be an upside correction, but the price is likely to face sellers near $0.2600 or $0.2620.
Ripple price is facing a lot of hurdles on the upsides against the US Dollar and bitcoin. XRP price remains at a risk of more downsides unless it settles above $0.2650.
Ripple Price Analysis
This past week, we saw a significant decline in bitcoin, Ethereum and ripple against the US Dollar. XRP broke the key $0.2650 and $0.2600 support levels to enter a bearish zone. Moreover, there was a close below $0.2650 and the 100 hourly simple moving average. It opened the doors for more downsides and the price traded towards the $0.2500 level. A swing low was formed near $0.2460 and later the price corrected higher.
A decent support base was formed near $0.2475 and recently the price corrected above $0.2500. Moreover, there was a break above the $0.2550 resistance. However, the price struggled to gain momentum above $0.2600. The recent swing high was formed near $0.2605 and the price dipped back towards $0.2500. The recent low was formed at $0.2507 and the price is currently correcting higher.
It traded above $0.2550 plus the 50% Fib retracement level of the recent decline from the $0.2605 high to $0.2507 low. However, the $0.2580 level seems to be acting as a strong resistance. Additionally, ripple price failed near the 76.4% Fib retracement level of the recent decline from the $0.2605 high to $0.2507 low. More importantly, there is a key bearish trend line forming with resistance near $0.2570 on the hourly chart of the XRP/USD pair.
Therefore, an upside break above the $0.2580 and $0.2600 levels is needed for more upsides. The next key resistance is near the $0.2620 level (the previous support). Having said that, the price must break the $0.2650 resistance to move back into a positive zone.
Looking at the chart, ripple price is facing a lot of hurdles on the upside near $0.2600 and $0.2620. On the downside, an immediate support is at $0.2500. The main support is at $0.2475, below which the price could tumble towards $0.2400.
Technical Indicators
Hourly MACD – The MACD for XRP/USD is struggling to gain pace in the bullish zone.
Hourly RSI (Relative Strength Index) – The RSI for XRP/USD is currently near the 50 level.
Major Support Levels – $0.2520, $0.2500 and $0.2475.
Major Resistance Levels – $0.2580, $0.2600 and $0.2620.
The post Ripple Price (XRP) Primed For More Downsides Near Term appeared first on NewsBTC.
source https://www.tokentalk.co/NewsBTC/ripple-price-xrp-primed-for-more-downsides-near-term-5d6c94b1b98396a4770c9700
Sunday, 1 September 2019
Ripple Price (XRP) Primed For More Downsides Near Term @newsbtc #Analysis #Technical #Ripple #xrp
Subscribe to:
Post Comments (Atom)
This analyst says there’s a “high chance” Bitcoin may never fall under $5k again @cryptoslate #Analysis #Price Watch
Once Bitcoin (BTC) started to incur strong losses in the second half of 2019, analysts were once again making extremely low price prediction...

-
The Indian Ministry of Commerce and Industry announced yesterday that the Coffee Board in the country is integrating blockchain into the cof...
-
App-enabled cryptocurrency exchange and wallet provider, Zebpay, has announced that it is enabling Lightning Network payments for all its ...
-
Once Bitcoin (BTC) started to incur strong losses in the second half of 2019, analysts were once again making extremely low price prediction...


No comments:
Post a Comment