- Ripple price extended its decline and tested the key $0.2650 support area against the US dollar.
- The price could accelerate its decline if it fails to hold the key $0.2650 support.
- There is a maj...
- Ripple price extended its decline and tested the key $0.2650 support area against the US dollar.
- The price could accelerate its decline if it fails to hold the key $0.2650 support.
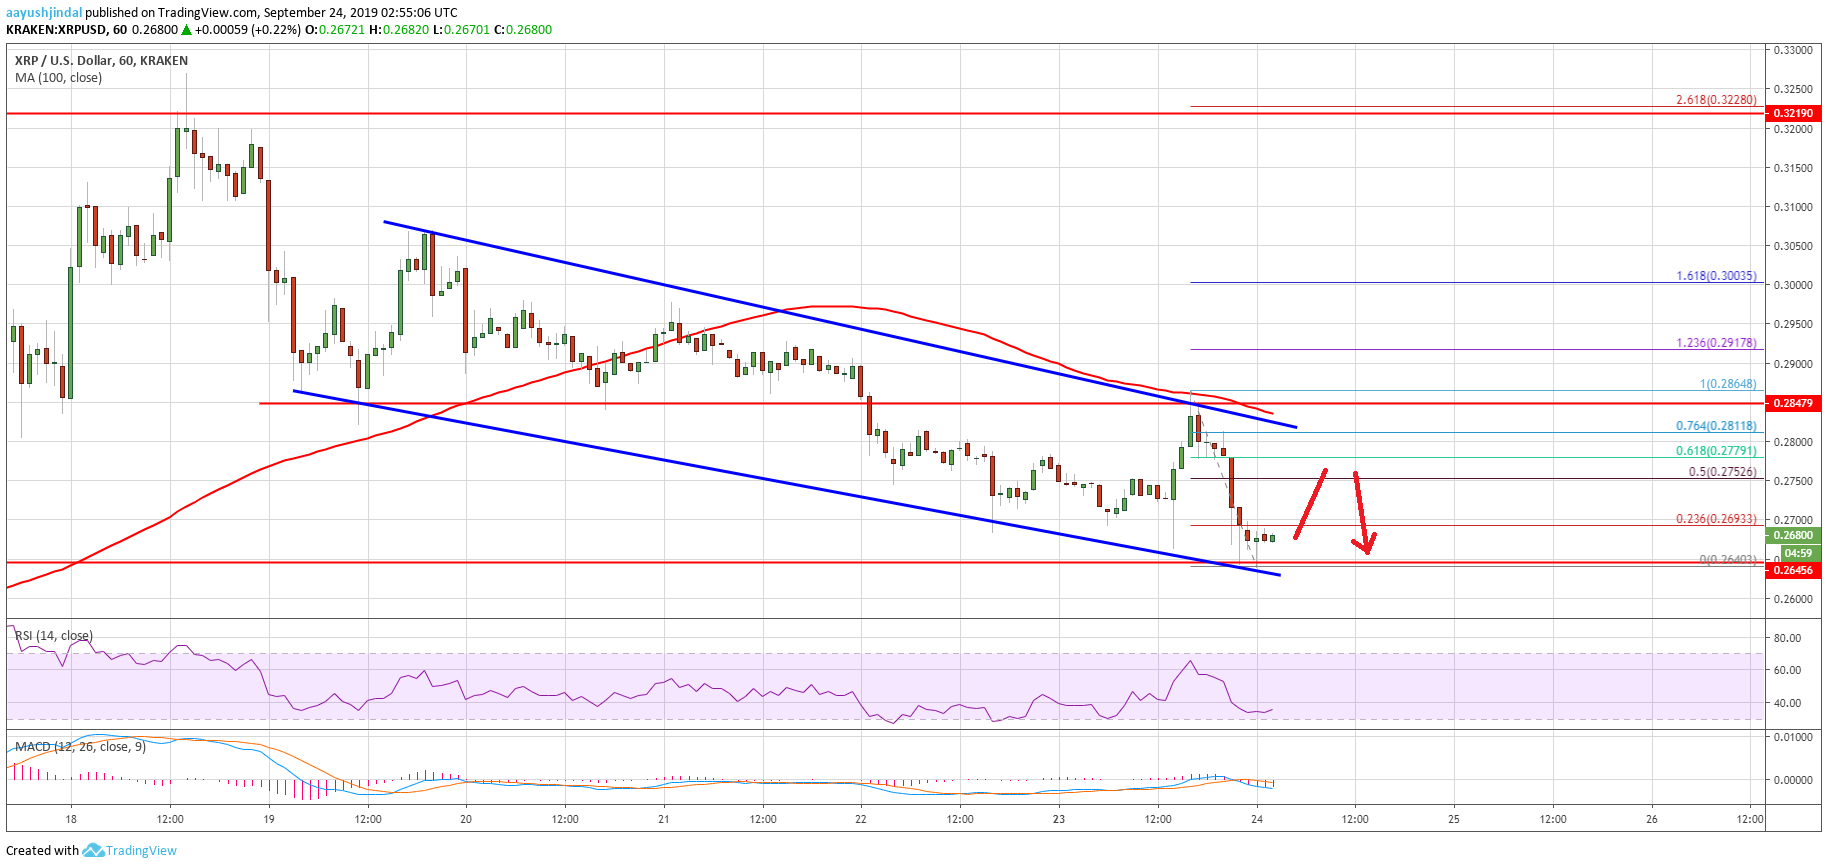
- There is a major declining channel forming with resistance near $0.2810 on the hourly chart of the XRP/USD pair (data source from Kraken).
- The price may perhaps correct higher, but upsides are likely to face hurdles near $0.2800 and $0.2850.
Ripple price is showing bearish signs against the US Dollar, similar to bitcoin and Ethereum. XRP price must stay above $0.2650 to start a decent recovery in the near term.
Ripple Price Analysis
In the past few days, ripple price followed a bearish path and settled below $0.300 against the US Dollar. The XRP/USD pair even broke the $0.2850 support area and the 100 hourly simple moving average. The recent decline was such that the price traded below the $0.2720 level and tested the main support area near $0.2650 (the previous breakout resistance).
The recent low was formed near $0.2640 and the price is currently consolidating. An immediate resistance is near the $0.2695 level. It coincides with the 23.6% Fib retracement level of the recent decline from the $0.2864 high to $0.2640 low. On the upside, there are many resistances near the $0.2750 and $0.2800 levels. Additionally, the 50% Fib retracement level of the recent decline from the $0.2864 high to $0.2640 low is near $0.2752.
More importantly, there is a major declining channel forming with resistance near $0.2810 on the hourly chart of the XRP/USD pair. The channel resistance is close to the 100 hourly SMA at $0.2820. Therefore, ripple price is likely to face a strong resistance near the $0.2800 and $0.2850 levels. A successful close above the $0.2850 resistance could open the doors for the fresh increase.
Conversely, if the price fails to correct higher above $0.2750 or $0.2800, it could continue to decline. The main support is near the $0.2650 and $0.2640 levels. A convincing break below the $0.2650 support area might start a solid decline in the coming sessions. The next key supports are near the $0.2550 and $0.2500 levels.
Looking at the chart, ripple price is showing bearish signs below $0.2750 and $0.2800. The current price action is bearish, but there are a few possibilities of a decent recovery as long as the price is above $0.2650. If not, the price may soon test $0.2500.
Technical Indicators
Hourly MACD – The MACD for XRP/USD is gaining strength in the bearish zone.
Hourly RSI (Relative Strength Index) – The RSI for XRP/USD is currently well below the 40 level.
Major Support Levels – $0.2650, $0.2640 and $0.2500.
Major Resistance Levels – $0.2750, $0.2810 and $0.0.2850.
The post Ripple Price (XRP) Testing Crucial Support With Bearish Bias appeared first on NewsBTC.
source https://www.tokentalk.co/NewsBTC/ripple-price-xrp-testing-crucial-support-with-bearish-bias-5d8994c13760a02d24e94861
Monday, 23 September 2019
Ripple Price (XRP) Testing Crucial Support With Bearish Bias @newsbtc #Analysis #Technical #Ripple #xrp
Subscribe to:
Post Comments (Atom)
This analyst says there’s a “high chance” Bitcoin may never fall under $5k again @cryptoslate #Analysis #Price Watch
Once Bitcoin (BTC) started to incur strong losses in the second half of 2019, analysts were once again making extremely low price prediction...

-
The Indian Ministry of Commerce and Industry announced yesterday that the Coffee Board in the country is integrating blockchain into the cof...
-
App-enabled cryptocurrency exchange and wallet provider, Zebpay, has announced that it is enabling Lightning Network payments for all its ...
-
Once Bitcoin (BTC) started to incur strong losses in the second half of 2019, analysts were once again making extremely low price prediction...


No comments:
Post a Comment