- Ethereum price declined recently and traded below the $180 support area against the US Dollar.
- Bitcoin is under pressure and it seems to be struggling to stay above the $9,000 support.
- There is a...
- Ethereum price declined recently and traded below the $180 support area against the US Dollar.
- Bitcoin is under pressure and it seems to be struggling to stay above the $9,000 support.
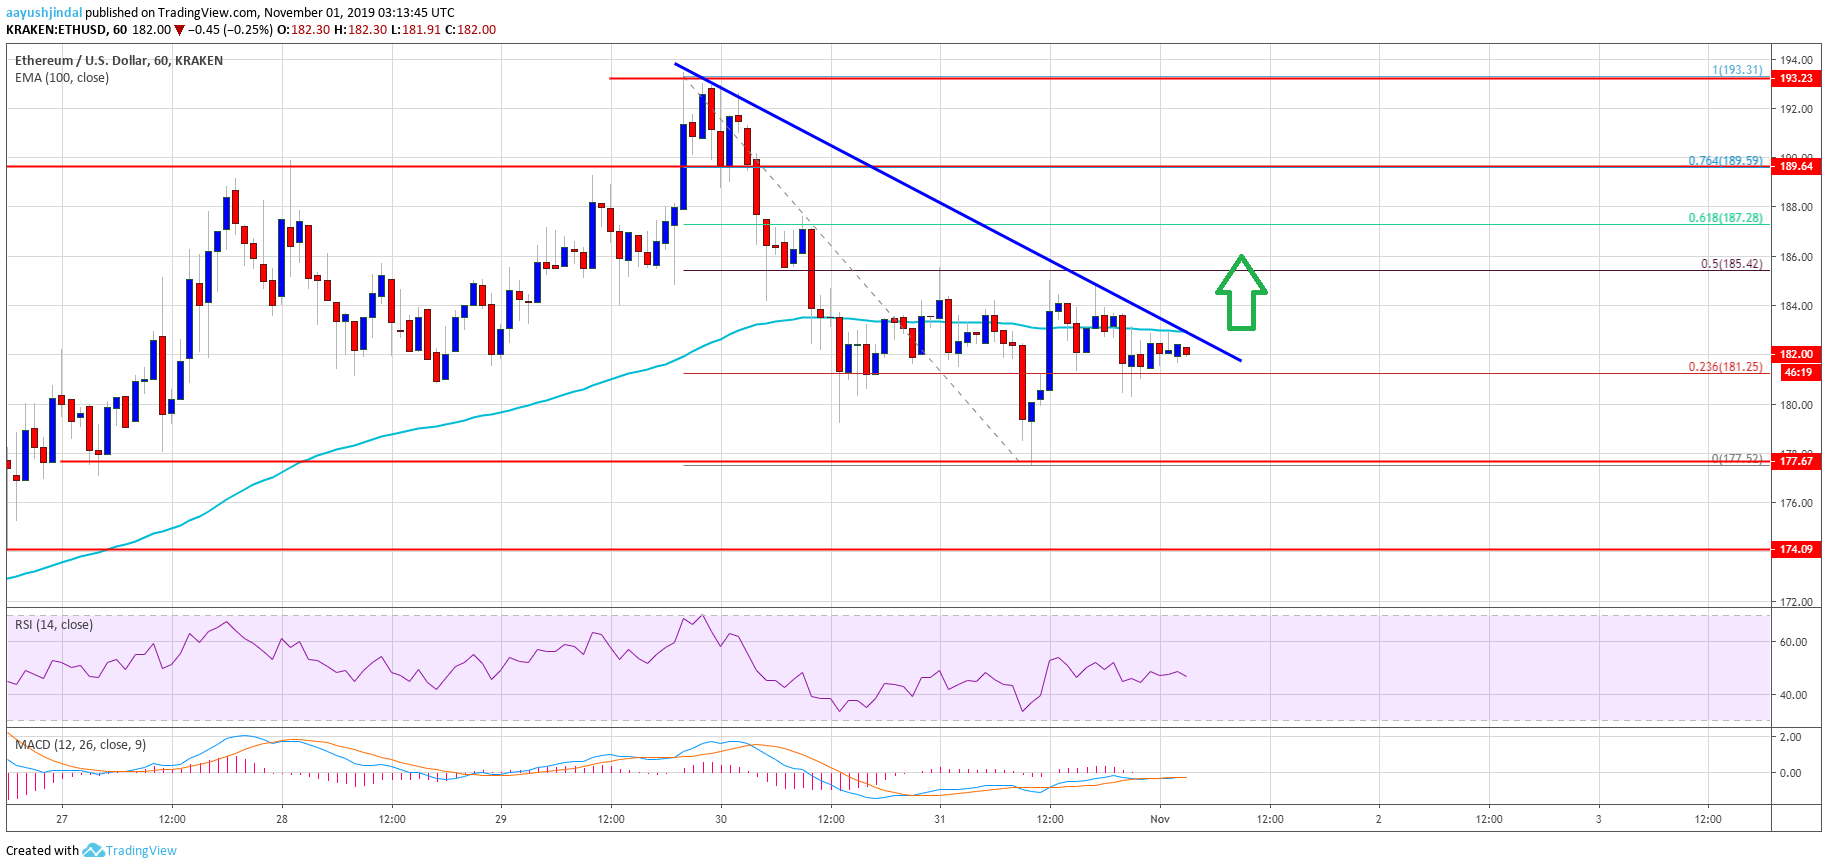
- There is a new connecting bearish trend line forming with resistance near $183 on the hourly chart of ETH/USD (data feed via Kraken).
- The pair could start a decent upward move if it breaks the $183 and $185 resistance levels.
Ethereum price is showing a few bearish signs versus the US Dollar, similar to bitcoin. However, ETH price is likely to find a strong support near the $175 level.
Ethereum Price Analysis
In the past few sessions, there was a steady decline in Ethereum below the $185 support area against the US Dollar. Moreover, there was a close below the $185 level and the 100 hourly simple moving average.
Finally, ETH spiked below the $180 support and traded to a new intraday low near $177. Recently, there was an upside correction above the $180 and $182 levels.
Ethereum price managed to move above the 23.6% Fib retracement level of the recent drop from the $194 high to $177 low. However, the previous support near the $185 area acted as a resistance and prevented an upside break.
Besides, the pair failed to test the 50% Fib retracement level of the recent drop from the $194 high to $177 low. More importantly, there is a new connecting bearish trend line forming with resistance near $183 on the hourly chart of ETH/USD.
The 100 hourly SMA is also near the $183 level. Therefore, an upside break above the $183 level might push the price above the $185 resistance. The next key resistance is near the $188 level, followed by $190.
On the downside, an immediate support is near the $178 level. The main support is near the $175 level, where the bulls are likely to take a stand. If there is a downside break below the $175 level, there are chances of more losses below the $172 and $170 levels.
Looking at the chart, Ethereum price is struggling to hold the $180 and $178 supports. It could either break the $185 resistance or extend losses below the $175 support. Having said that, a clear break below the $175 support won’t be easy in the coming sessions. Below $175, the next buy zone could be near the $165 area.
ETH Technical Indicators
Hourly MACD – The MACD for ETH/USD is slowly gaining pace in the bearish zone.
Hourly RSI – The RSI for ETH/USD is currently decline and it is moving lower towards the 40 level.
Major Support Level – $175
Major Resistance Level – $185
The post Ethereum (ETH) Stuck In Range, Bitcoin Struggling Near $9K appeared first on NewsBTC.
source https://www.tokentalk.co/NewsBTC/ethereum-eth-stuck-in-range-bitcoin-struggling-near-9k-5dbbadc13b5a709c14f64b69
Thursday, 31 October 2019
Ethereum (ETH) Stuck In Range, Bitcoin Struggling Near $9K @newsbtc #Analysis #Technical #ETH #ethereum
Subscribe to:
Post Comments (Atom)
This analyst says there’s a “high chance” Bitcoin may never fall under $5k again @cryptoslate #Analysis #Price Watch
Once Bitcoin (BTC) started to incur strong losses in the second half of 2019, analysts were once again making extremely low price prediction...

-
The Indian Ministry of Commerce and Industry announced yesterday that the Coffee Board in the country is integrating blockchain into the cof...
-
App-enabled cryptocurrency exchange and wallet provider, Zebpay, has announced that it is enabling Lightning Network payments for all its ...
-
Disclaimer: These summaries are provided for educational purposes only by Nelson Rosario and Stephen Palley... Disclaimer: These summaries...

No comments:
Post a Comment