- ETH price is currently trimming gains from the $158 resistance area against the US Dollar.
- The price is now approaching a couple of important supports near the $144 area.
- Earlier, there was a bre...
- ETH price is currently trimming gains from the $158 resistance area against the US Dollar.
- The price is now approaching a couple of important supports near the $144 area.
- Earlier, there was a break above a major bearish trend line with resistance near $152 on the 4-hours chart of ETH/USD (data feed via Kraken).
- The pair is likely to bounce back as long as it is above the $142 support area.
Ethereum price is approaching a crucial support area against the US Dollar, similar to bitcoin. ETH price must hold the $142 support to climb towards $160.
Ethereum Price Weekly Analysis
This past week, Ethereum started a solid recovery above the $142 resistance area against the US Dollar. Furthermore, ETH price surpassed a major resistance area near the $150 level.
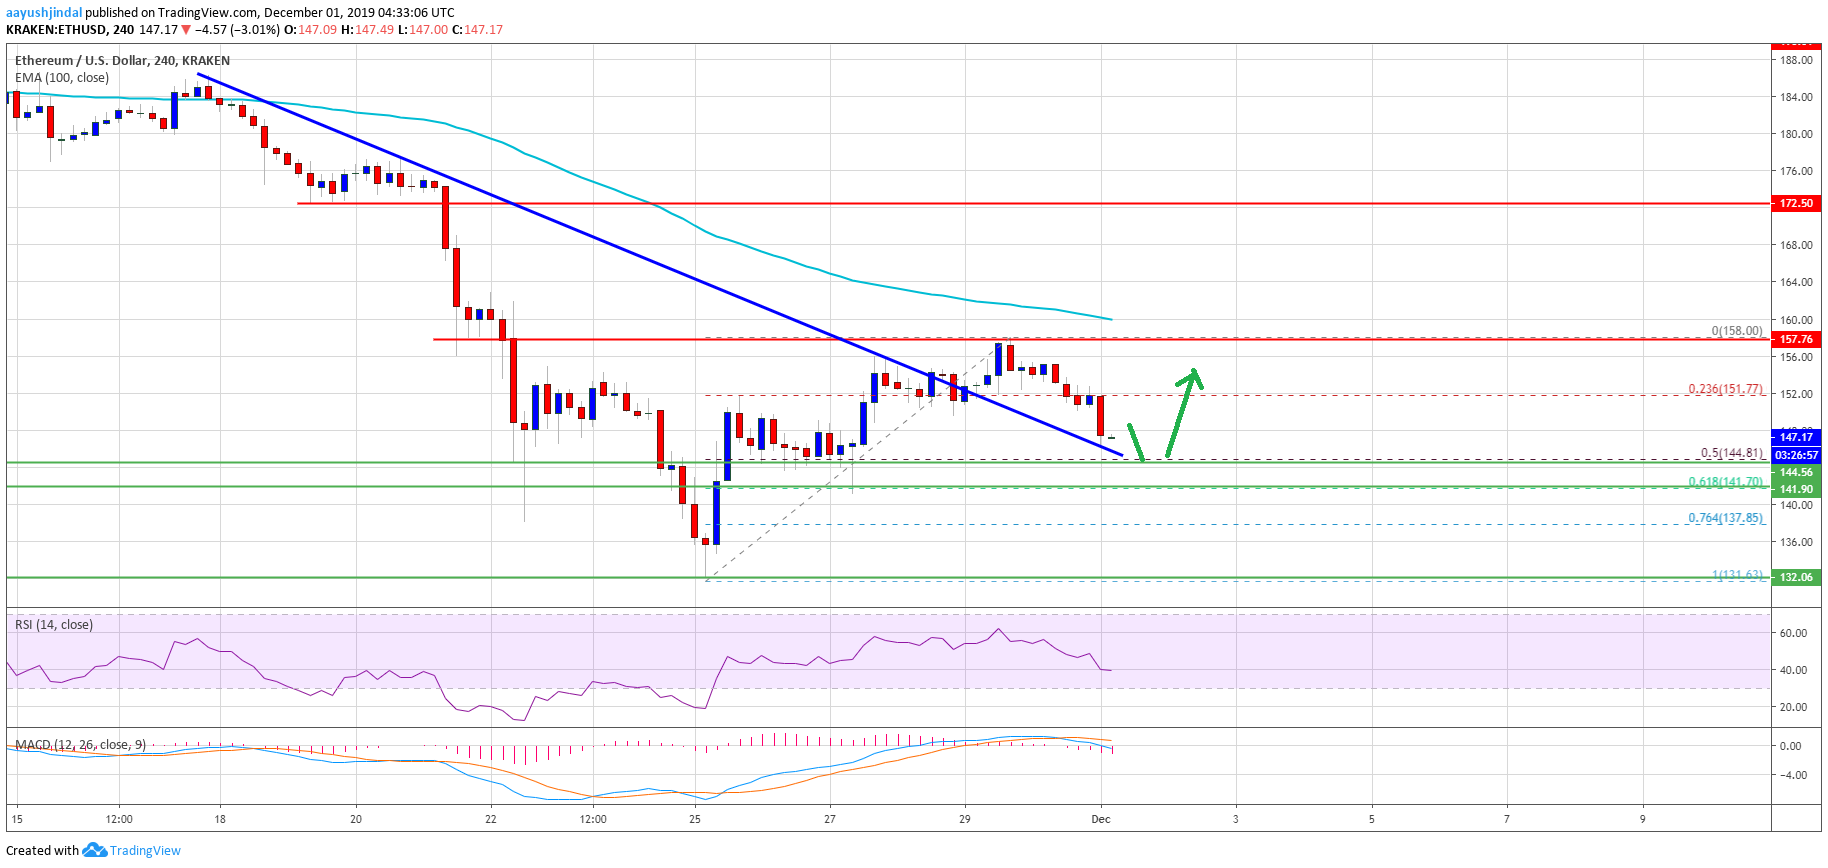
More importantly, there was a break above a major bearish trend line with resistance near $152 on the 4-hours chart of ETH/USD. Besides, the pair surpassed the $155 resistance area, but it struggled to gain momentum above $158.
A swing high was formed near $158 and the price remained well below the 100 simple moving average (4-hours). Ethereum is currently correcting lower below the 23.6% Fib retracement level of the upward move from the $131 swing low to $158 high.
The price is now approaching the broken trend line and the $145 support area. Additionally, the 50% Fib retracement level of the upward move from the $131 swing low to $158 high is near the $145 level.
The main support is near the $142 area. It is near the 61.8% Fib retracement level of the upward move from the $131 swing low to $158 high. Therefore, a downside break below the $142 support area could reduce chances of another upward move in the near term.
In the mentioned scenario, the price is likely to revisit the $134 and $132 support levels. On the upside, the first key resistance is near the $152 level. The key resistance area is near the $158 and $160 levels.
Thus, a clear break above the $160 level and the 100 simple moving average (4-hours) may perhaps push the price back into a positive zone.
Ethereum Price
The above chart indicates that Ethereum price is clearly approaching a couple of important supports near $145 and $142. As long as the price is above $142, it could bounce back. If not, the bears are likely to aim $132 or $125.
Technical Indicators
4 hours MACD – The MACD for ETH/USD is currently gaining strength in the bullish zone.
4 hours RSI – The RSI for ETH/USD is currently declining and it is near the 40 level.
Major Support Level – $142
Major Resistance Level – $160
The post Ethereum Price Weekly Forecast: ETH At Potentially Significant Turning Point appeared first on NewsBTC.
source https://www.tokentalk.co/NewsBTC/ethereum-price-weekly-forecast-eth-at-potentially-significant-turning-point-5de355013675c46b4ce215e6
Saturday, 30 November 2019
Ethereum Price Weekly Forecast: ETH At Potentially Significant Turning Point @newsbtc #Analysis #Technical #ETH #ethereum
Subscribe to:
Post Comments (Atom)
This analyst says there’s a “high chance” Bitcoin may never fall under $5k again @cryptoslate #Analysis #Price Watch
Once Bitcoin (BTC) started to incur strong losses in the second half of 2019, analysts were once again making extremely low price prediction...

-
The Indian Ministry of Commerce and Industry announced yesterday that the Coffee Board in the country is integrating blockchain into the cof...
-
App-enabled cryptocurrency exchange and wallet provider, Zebpay, has announced that it is enabling Lightning Network payments for all its ...
-
Disclaimer: These summaries are provided for educational purposes only by Nelson Rosario and Stephen Palley... Disclaimer: These summaries...

No comments:
Post a Comment