- Ripple price is trading nicely above the $0.2200 and $0.2180 support levels against the US dollar.
- The price is likely to accelerate gains if it breaks the $0.2300 resistance area.
- There is a new...
- Ripple price is trading nicely above the $0.2200 and $0.2180 support levels against the US dollar.
- The price is likely to accelerate gains if it breaks the $0.2300 resistance area.
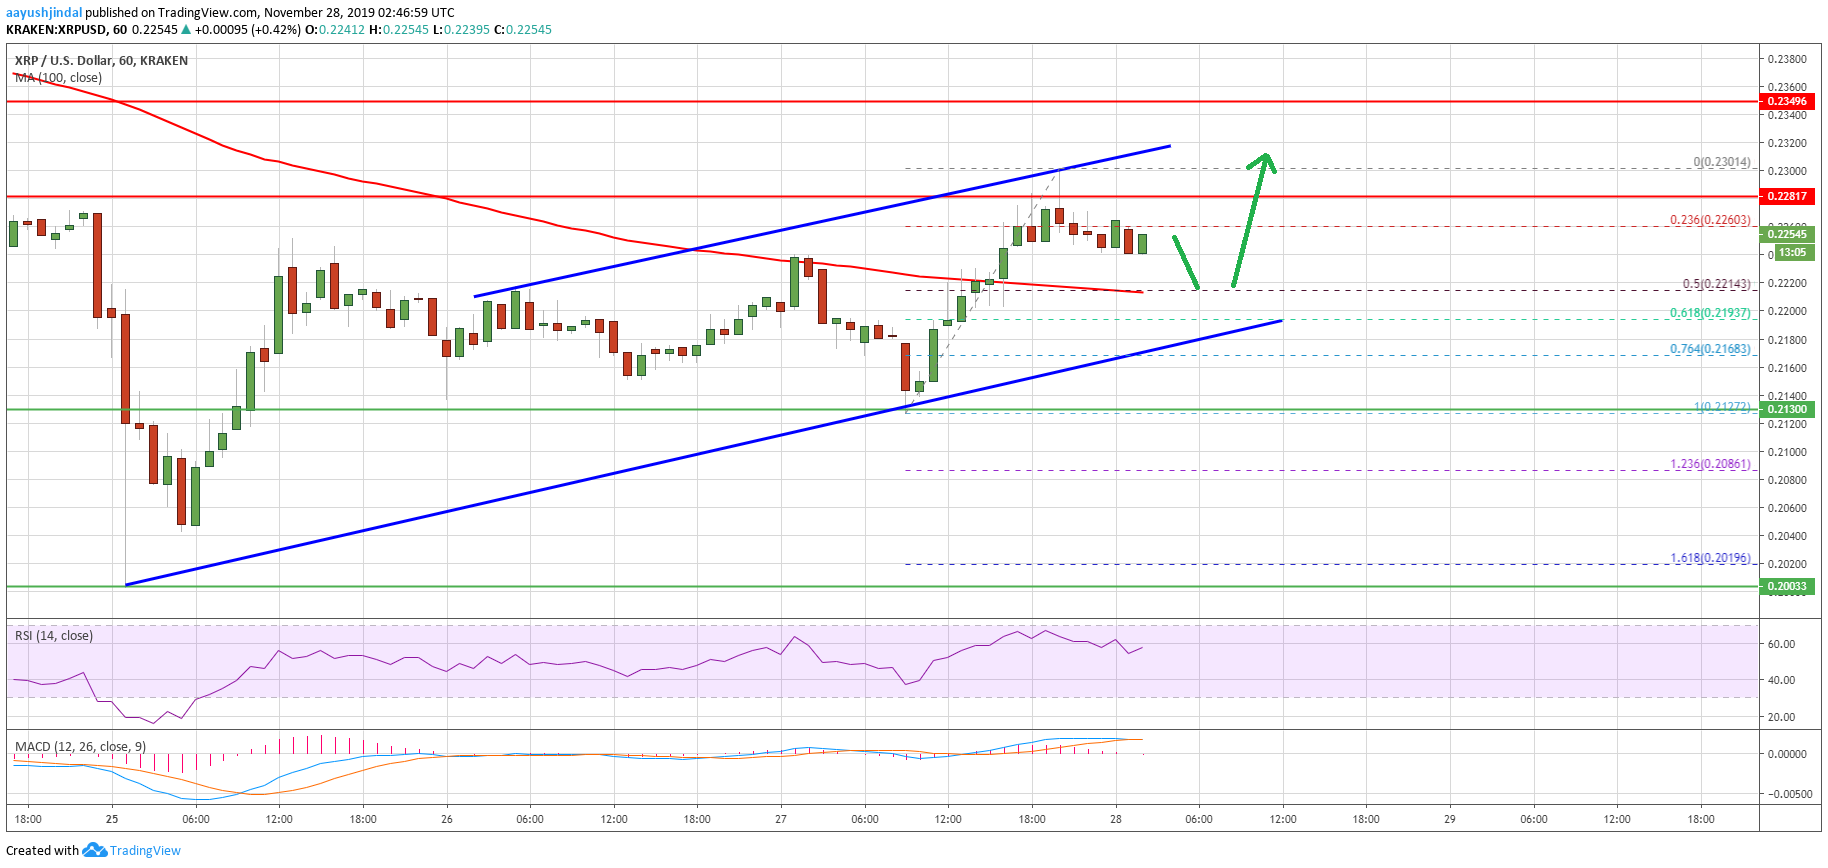
- There is a new connecting bullish trend line forming with support near $0.2190 on the hourly chart of the XRP/USD pair (data source from Kraken).
- The main hurdles on the upside for the bulls are near $0.2300 and $0.2350.
Ripple is gaining bullish momentum above $0.2200 against the US Dollar, similar to bitcoin above $7,000. XRP price is likely to accelerate gains above $0.2300 and $0.2320.
Ripple Price Analysis
After forming a support base above $0.2000, ripple started a decent upward move against the US Dollar. XRP price broke a couple of key resistances near the $0.2100 and $0.2150 levels.
Finally, it managed to climb above the $0.2180 resistance and the 100 hourly simple moving average. Therefore, it opened the doors for more upsides above the $0.2200 resistance. The recent recovery was such that the price even climbed above the $0.2250 resistance.
The price traded as high as $0.2301 and it is currently correcting gains. Additionally, it traded below the 23.6% Fib retracement level of the upward wave from the $0.2127 low to $0.2301 high.
On the downside, there are many supports near the $0.2200 level and the 100 hourly simple moving average. Moreover, there is a new connecting bullish trend line forming with support near $0.2190 on the hourly chart of the XRP/USD pair.
The 50% Fib retracement level of the upward wave from the $0.2127 low to $0.2301 high is also near the 100 hourly SMA to provide support. If there is a downside break below the trend line, ripple may possibly retest the $0.2140 and $0.2130 support levels.
Any further losses could push the price back into a bearish zone below the $0.2100 support. The next major support is near the recent monthly low of $0.2000.
On the upside, an initial resistance is near the $0.2300 level. A successful break above the $0.2300 hurdle is likely to lead the price towards the $0.2350 resistance. The final target for the current recovery could be near the $0.2380 level.
Ripple Price
Looking at the chart, ripple price is trading above a couple of key supports near $0.2200 and $0.2180. As long as there is no close below $0.2180, the price is likely to climb above $0.2300 and $0.2350 in the near term.
Technical Indicators
Hourly MACD – The MACD for XRP/USD is slowly moving back into the bearish zone.
Hourly RSI (Relative Strength Index) – The RSI for XRP/USD is currently well above the 50 level, with positive signs.
Major Support Levels – $0.2200, $0.2180 and $0.2140.
Major Resistance Levels – $0.2300, $0.2350 and $0.2380.
The post Ripple (XRP) Price Defies Gravity, Looks To Trade Higher appeared first on NewsBTC.
source https://www.tokentalk.co/NewsBTC/ripple-xrp-price-defies-gravity-looks-to-trade-higher-5ddf4af1e42dd88306691281
Wednesday, 27 November 2019
Ripple (XRP) Price Defies Gravity, Looks To Trade Higher @newsbtc #Analysis #Technical #Ripple #xrp
Subscribe to:
Post Comments (Atom)
This analyst says there’s a “high chance” Bitcoin may never fall under $5k again @cryptoslate #Analysis #Price Watch
Once Bitcoin (BTC) started to incur strong losses in the second half of 2019, analysts were once again making extremely low price prediction...

-
The Indian Ministry of Commerce and Industry announced yesterday that the Coffee Board in the country is integrating blockchain into the cof...
-
App-enabled cryptocurrency exchange and wallet provider, Zebpay, has announced that it is enabling Lightning Network payments for all its ...
-
Disclaimer: These summaries are provided for educational purposes only by Nelson Rosario and Stephen Palley... Disclaimer: These summaries...

No comments:
Post a Comment