- There was a strong decline in bitcoin price below the $5,280 support level against the US Dollar.
- The price even spiked below the $5,000 support level and it is currently consolidating above $5,100.
- ...
- There was a strong decline in bitcoin price below the $5,280 support level against the US Dollar.
- The price even spiked below the $5,000 support level and it is currently consolidating above $5,100.
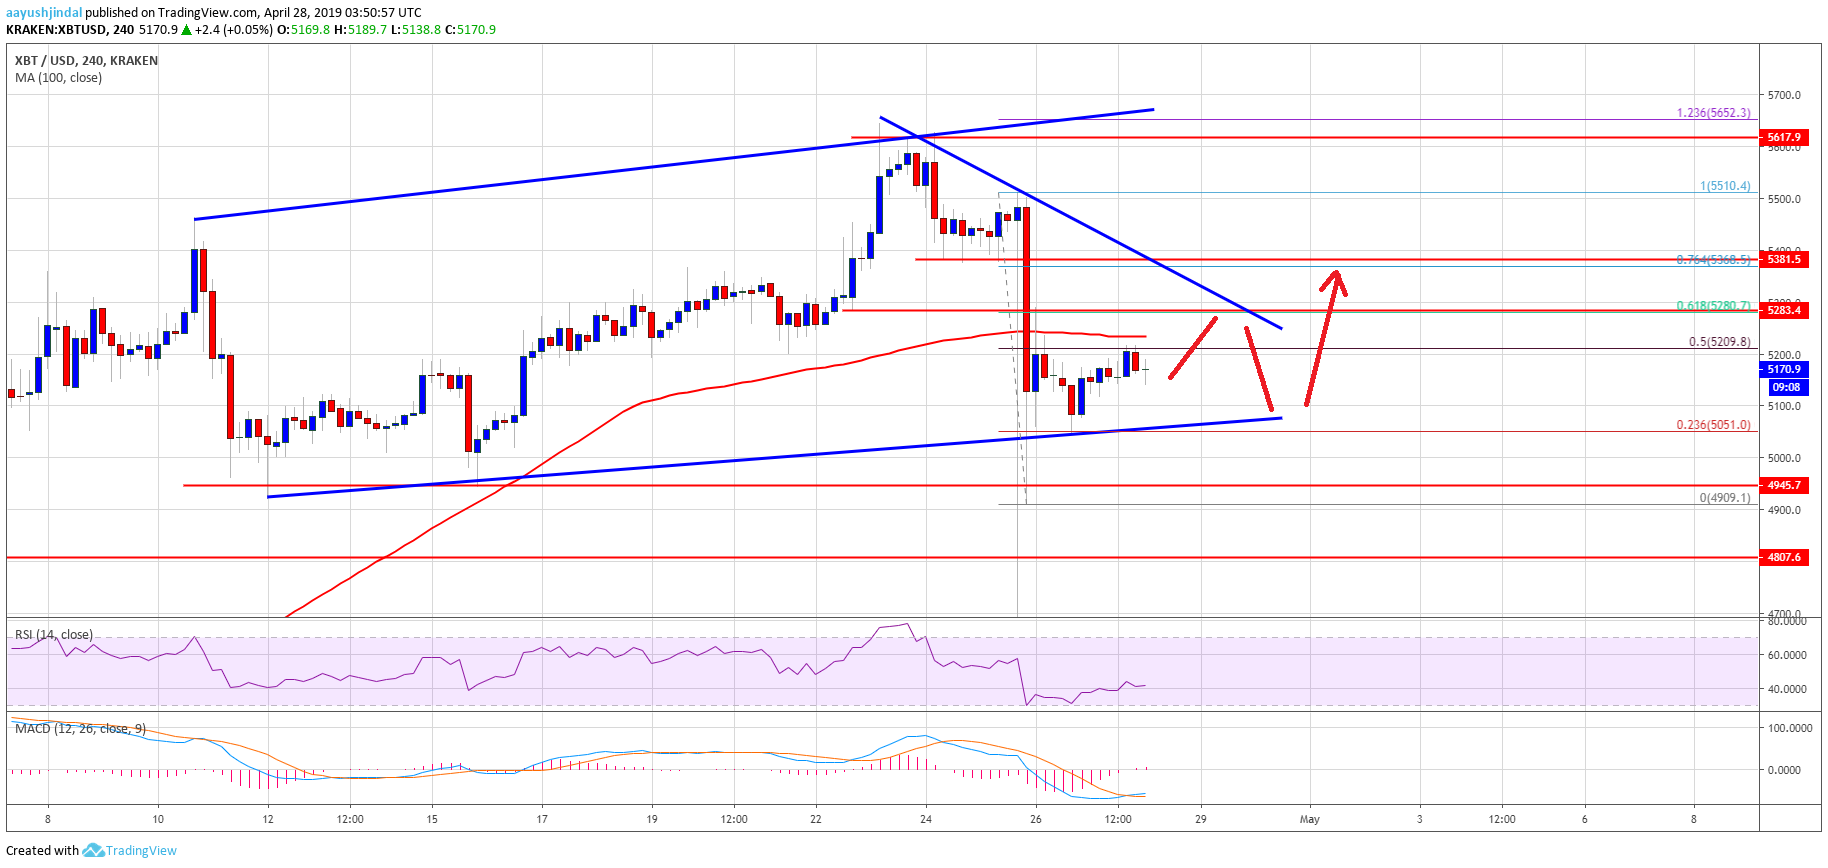
- There is a major bullish trend line in place with support at $5,080 on the 4-hours chart of the BTC/USD pair (data feed from Kraken).
- The pair could bounce back as long as there is no weekly close below the $5,000 support level.
Bitcoin price started consolidating losses after a strong decline against the US Dollar. BTC is likely to recover above $5,200 and $5,280 in the near term unless the $5,000 gives way.
Bitcoin Price Weekly Analysis (BTC)
This past week, there was a significant rejection in bitcoin price near the $5,660 level against the US Dollar. The BTC/USD pair started a strong downward move below $5,400 after tether’s drama. The price tumbled below the key $5,280 and $5,200 support levels. There was even a spike below $5,000, plus a close below the 100 simple moving average (4-hours). A swing low was formed near the $4,910 level and recently the price recovered above $5,000 and $5,050.
At the moment, the price is testing the 50% Fib retracement level of the last drop from the $5,510 swing high to $4,910 swing low. However, the $5,220 area and the 100 simple moving average (4-hours) are acting as hurdles. Above $5,220, there is a major resistance near $5,280 and a connecting bearish trend line. The 61.8% Fib retracement level of the last drop from the $5,510 swing high to $4,910 swing low is also near the $5,280 level. A successful close above the $5,280 level might trigger a decent recovery in the near term.
On the downside, there is a major bullish trend line in place with support at $5,080 on the 4-hours chart of the BTC/USD pair. The trend line support near $5,080 is very important, below which the price could test $5,000. If there is a daily close below $5,000, the price is likely to move further into a bearish zone. In the mentioned case, the price will most likely test $4,800 or $4,750.
Looking at the chart, bitcoin price faced a strong selling interest below $5,400. However, it managed to stay above the $5,000 support. Therefore, there are chances of a recovery above the $5,280 resistance levels. If there is a close above $5,280, there are chances of move towards $5,400 or even $5,500.
Technical indicators
4 hours MACD – The MACD for BTC/USD is slowly moving into the bullish zone.
4 hours RSI (Relative Strength Index) – The RSI for BTC/USD is back above the 40 level, with a few positive signs.
Major Support Level – $5,050
Major Resistance Level – $5,280
The post Bitcoin (BTC) Price Eyeing Last Line Of Defense: Buy Dips? appeared first on NewsBTC.
source https://www.tokentalk.co/NewsBTC/bitcoin-btc-price-eyeing-last-line-of-defense-buy-dips-5cc53351b8ce0e646c2c35fd
Saturday, 27 April 2019
Bitcoin (BTC) Price Eyeing Last Line Of Defense: Buy Dips? @newsbtc #Analysis #Technical #bitcoin #btc
Subscribe to:
Post Comments (Atom)
This analyst says there’s a “high chance” Bitcoin may never fall under $5k again @cryptoslate #Analysis #Price Watch
Once Bitcoin (BTC) started to incur strong losses in the second half of 2019, analysts were once again making extremely low price prediction...

-
The Indian Ministry of Commerce and Industry announced yesterday that the Coffee Board in the country is integrating blockchain into the cof...
-
App-enabled cryptocurrency exchange and wallet provider, Zebpay, has announced that it is enabling Lightning Network payments for all its ...
-
Once Bitcoin (BTC) started to incur strong losses in the second half of 2019, analysts were once again making extremely low price prediction...


No comments:
Post a Comment