- ETH price declined heavily this past week and broke the $166 and $160 supports against the US Dollar.
- The price even broke the $155 support level and traded close to the $146 level.
- There is a cr...
- ETH price declined heavily this past week and broke the $166 and $160 supports against the US Dollar.
- The price even broke the $155 support level and traded close to the $146 level.
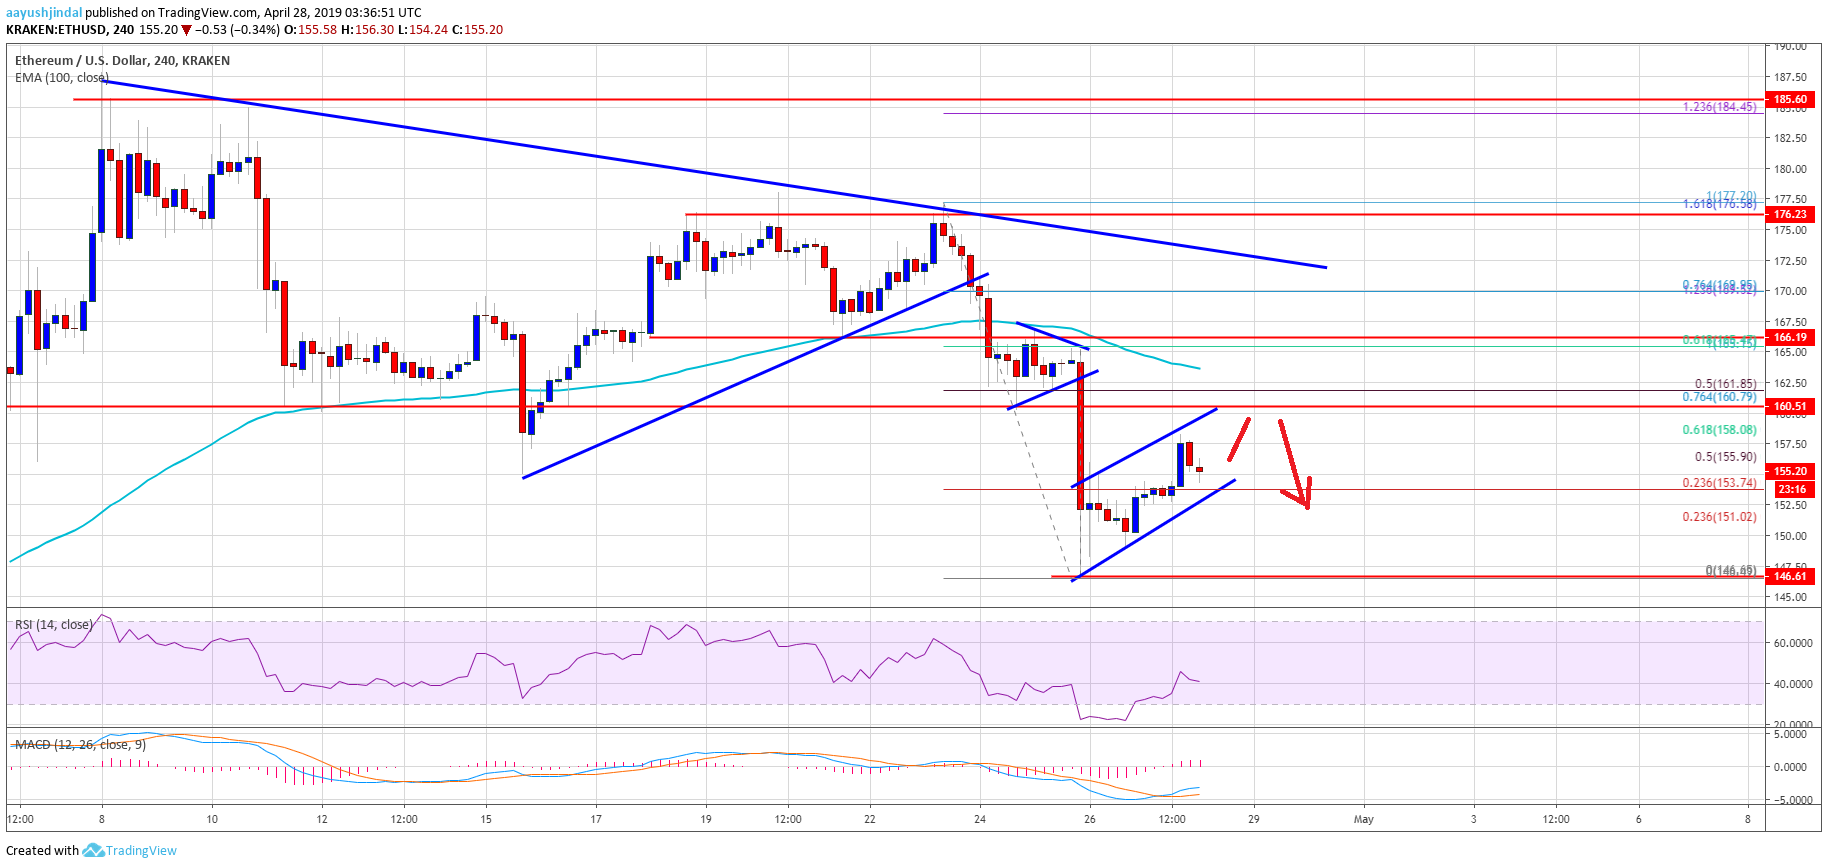
- There is a crucial bearish trend line formed with resistance at $172 on the 4-hours chart of ETH/USD (data feed via Kraken).
- The pair could correct higher in the short term, but it is likely to face sellers near $160 or $162.
Ethereum price declined below important support levels versus the US Dollar and bitcoin. ETH is currently correcting higher, but it is likely to struggle near $160, $162 and $165.
Ethereum Price Weekly Analysis
This past week, Ethereum price started a major downward move below the $170 support against the US Dollar. The ETH/USD pair traded below the $166 and $160 support levels to enter a bearish zone. Besides, there was a close below the $160 level and the 100 simple moving average (4-hours). Finally, the price even broke the $155 support levels and spiked below $150. A new weekly low was formed just above $146 and the price recently corrected higher.
There was a break above $152 and the 23.6% Fib retracement level of the last decline from the $172 high to $146 swing low. The pair seems to be following a short term ascending channel with support at $153 on the 4-hours chart of ETH/USD. On the upside, there are many hurdles for the bulls near the $160 level. Above $160, the next key resistance is near $162 and the 100 simple moving average (4-hours). The 50% Fib retracement level of the last decline from the $172 high to $146 swing low is also near $162.
More importantly, there is a crucial bearish trend line formed with resistance at $172 on the same chart. Therefore, if the price corrects higher, sellers are likely to protect the $160 or $162 resistance level. Only a close above $170 and the 100 simple moving average (4-hours) could open the doors for more gains. On the downside, a break below the $152 and $150 support could restart downtrend.
The above chart indicates that Ethereum is trading heavily below the $160 support. It is likely to remain in a bearish zone and sellers may enjoy recoveries near $160 and $162. On the downside, a daily close below $150 might start an extended decline towards the $142 and $134 levels in the near term.
Technical Indicators
4 hours MACD – The MACD for ETH/USD is currently struggling in the bullish zone.
4 hours RSI – The RSI for ETH/USD is currently moving higher, but it is well below the 50 level.
Major Support Level – $150
Major Resistance Level – $162
The post Ethereum (ETH) Price Larger Dip Underway: Bulls Losing Grip appeared first on NewsBTC.
source https://www.tokentalk.co/NewsBTC/ethereum-eth-price-larger-dip-underway-bulls-losing-grip-5cc52721b8ce0e646c2c35fc
Saturday, 27 April 2019
Ethereum (ETH) Price Larger Dip Underway: Bulls Losing Grip @newsbtc #Analysis #Technical #ETH #ethereum
Subscribe to:
Post Comments (Atom)
This analyst says there’s a “high chance” Bitcoin may never fall under $5k again @cryptoslate #Analysis #Price Watch
Once Bitcoin (BTC) started to incur strong losses in the second half of 2019, analysts were once again making extremely low price prediction...

-
The Indian Ministry of Commerce and Industry announced yesterday that the Coffee Board in the country is integrating blockchain into the cof...
-
App-enabled cryptocurrency exchange and wallet provider, Zebpay, has announced that it is enabling Lightning Network payments for all its ...
-
Once Bitcoin (BTC) started to incur strong losses in the second half of 2019, analysts were once again making extremely low price prediction...


No comments:
Post a Comment