- Bitcoin price is currently declining after it failed to surpass the $8,400 resistance against the US Dollar.
- The price is trading near the $8,000 support level, with a minor bearish angle.
- There ...
- Bitcoin price is currently declining after it failed to surpass the $8,400 resistance against the US Dollar.
- The price is trading near the $8,000 support level, with a minor bearish angle.
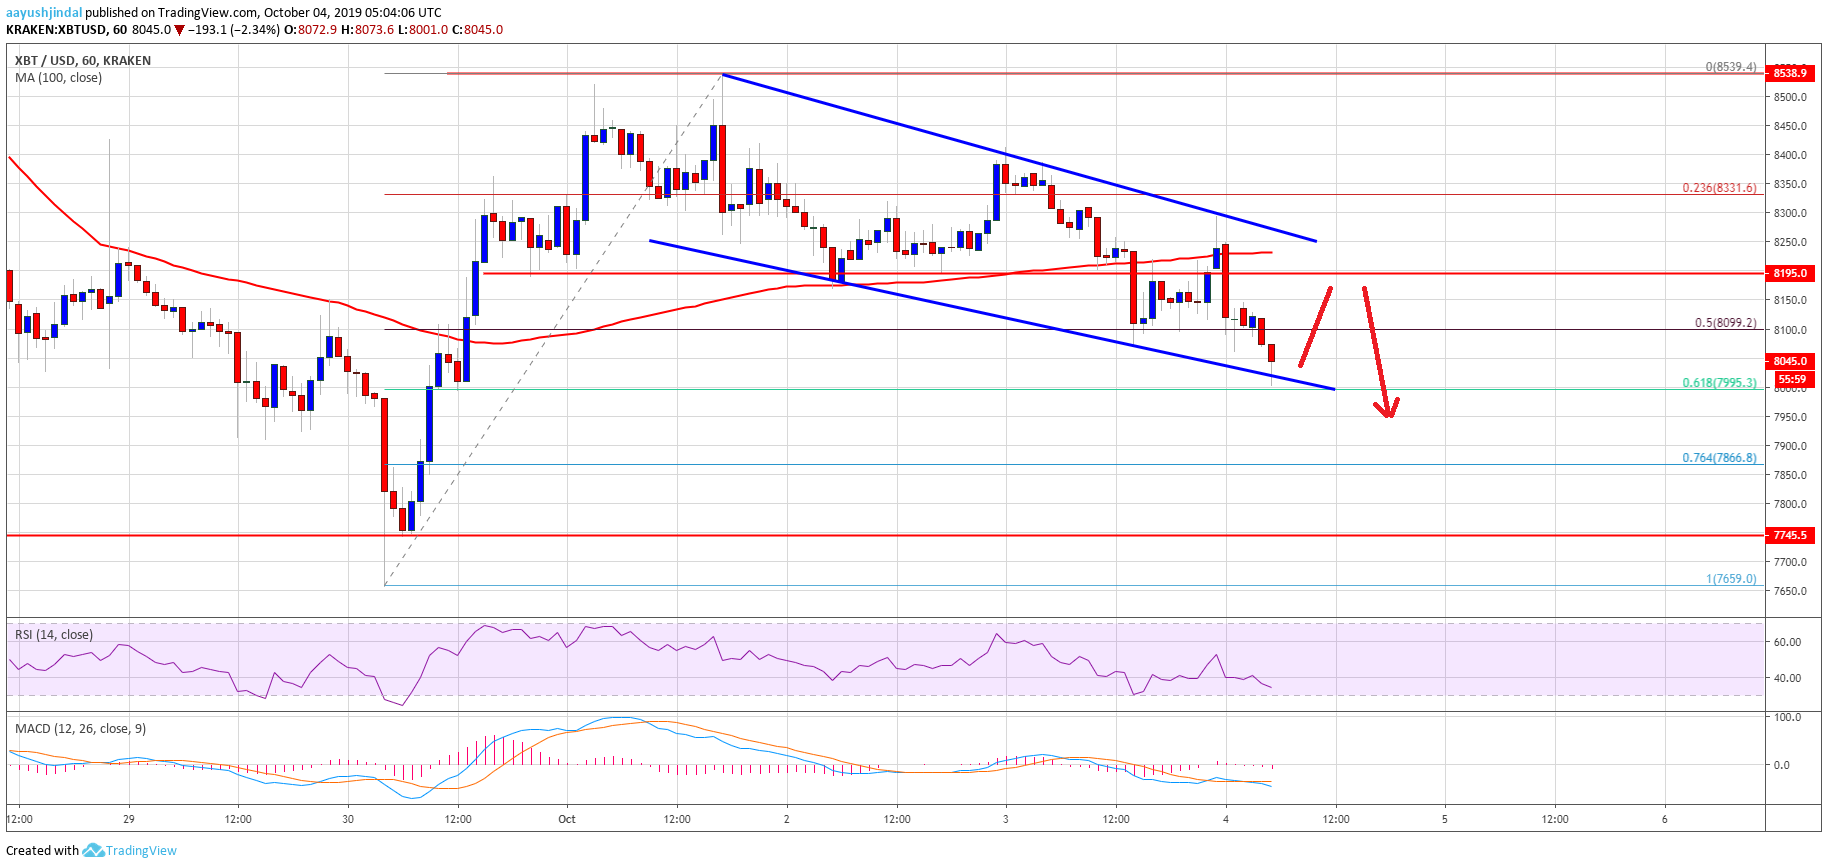
- There is a key declining channel forming with resistance near the $8,260 level on the hourly chart of the BTC/USD pair (data feed from Kraken).
- The price is at a risk of a downside break below the $8,000 support in the near term.
Bitcoin price is struggling to hold the key $8,000 support against the US Dollar. BTC might dip towards the $7,800 support area before it could start a decent recovery.
Bitcoin Price Analysis
In the past two sessions, there were bearish moves in bitcoin below $8,300 against the US Dollar. The BTC/USD pair followed a bearish path and broke the $8,200 support area. Moreover, there was a close below the $8,200 level and the 100 hourly simple moving average. The last swing high was formed near $8,300 before the price broke $8,200 support.
Additionally, there was a break below the 50% Fib retracement level of the upward move from the $7,659 low to $8,539 high. The recent decline was such that the price tested the $8,000 support area. More importantly, the price tested the 61.8% Fib retracement level of the upward move from the $7,659 low to $8,539 high. At the moment, the price is struggling to hold the $8,000 support area.
It seems like there is a key declining channel forming with resistance near the $8,260 level on the hourly chart of the BTC/USD pair. Thus, if there is a downside break below the $8,000 support, the price could accelerate its decline towards the $7,800 support area. Besides, an intermediate support is near $7,850 or the 76.4% Fib retracement level of the upward move from the $7,659 low to $8,539 high.
On the upside, there is a solid resistance forming near the $8,250 level and the 100 hourly SMA. Therefore, if there is an upside break above $8,250 and $8,300, the price could trade towards the main $8,500 resistance level in the near term.
Looking at the chart, bitcoin is clearly struggling to climb above the $8,300 level. Therefore, there is a risk of a downside break below the $8,000 support. In the mentioned case, the price could test the $7,800 support or trade to a new monthly low before it starts a decent recovery towards $9,000.
Technical indicators:
Hourly MACD – The MACD is slowly gaining momentum in the bearish zone.
Hourly RSI (Relative Strength Index) – The RSI for BTC/USD is currently well below the 50 level.
Major Support Levels – $8,000 followed by $7,800.
Major Resistance Levels – $8,250, $8,300 and $8,500.
The post Bitcoin Price (BTC) Downside Thrust Underway Before Fresh Rise appeared first on NewsBTC.
source https://www.tokentalk.co/NewsBTC/bitcoin-price-btc-downside-thrust-underway-before-fresh-rise-5d96de010edc6e2328fa9974
Thursday, 3 October 2019
Bitcoin Price (BTC) Downside Thrust Underway Before Fresh Rise @newsbtc #Analysis #Technical #bitcoin #btc
Subscribe to:
Post Comments (Atom)
This analyst says there’s a “high chance” Bitcoin may never fall under $5k again @cryptoslate #Analysis #Price Watch
Once Bitcoin (BTC) started to incur strong losses in the second half of 2019, analysts were once again making extremely low price prediction...

-
The Indian Ministry of Commerce and Industry announced yesterday that the Coffee Board in the country is integrating blockchain into the cof...
-
App-enabled cryptocurrency exchange and wallet provider, Zebpay, has announced that it is enabling Lightning Network payments for all its ...
-
Once Bitcoin (BTC) started to incur strong losses in the second half of 2019, analysts were once again making extremely low price prediction...


No comments:
Post a Comment