- There was a sharp decline in bitcoin below the $8,000 and $7,500 supports against the US Dollar.
- The price is currently correcting losses, but remains at a risk below $7,400.
- There is another bre...
- There was a sharp decline in bitcoin below the $8,000 and $7,500 supports against the US Dollar.
- The price is currently correcting losses, but remains at a risk below $7,400.
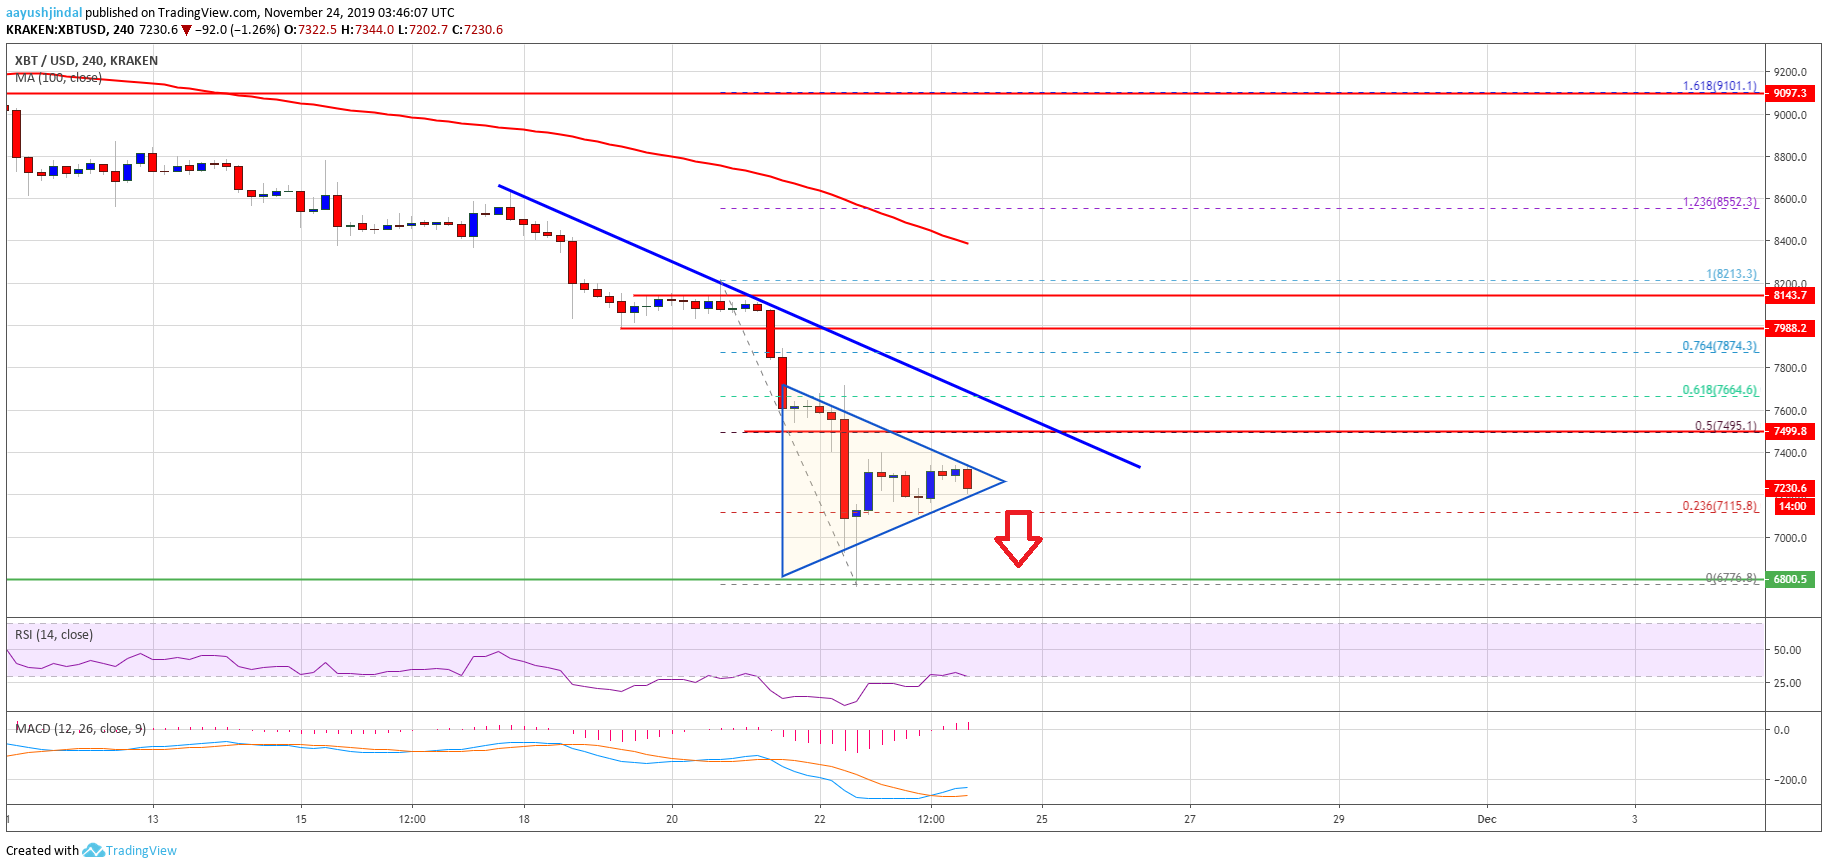
- There is another breakdown pattern forming with support near $7,240 on the 4-hours chart of the BTC/USD pair (data feed from Kraken).
- The price is currently trading below the $7,500 resistance and likely to decline further.
Bitcoin price is trading in a strong downtrend below $7,500 against the US Dollar. BTC is likely to continue lower towards the main $6,500 bearish target.
Bitcoin Price Weekly Analysis (BTC)
This past week, bitcoin started a nasty decline below the $8,000 support area against the US Dollar. As a result, BTC price gained bearish momentum below the $7,800 support and the 100 simple moving average (4-hours).
It opened the doors for more losses and the price even declined sharply below the $7,500 support. Moreover, the price tested the $7,000 support area (the first bearish target as per the medium term outlook).
Finally, the price spiked below $6,900 and a new multi-month low was formed near the $6,776 level. At the outset, bitcoin price is correcting higher and recently traded above the 23.6% Fib retracement level of the last decline from the $8,213 high to $6,776 low.
However, the upward correction is facing resistance near the $7,400 level. Additionally, there is another breakdown pattern forming with support near $7,240 on the 4-hours chart of the BTC/USD pair.
If there is a downside break below $7,240 and $7,200, there are chances of more downsides in the near term. In the mentioned case, the price is likely to break the $7,000 support and $6,800 level. The main target for the bears seem to be the $6,500 support area.
On the upside, the price must break the triangle resistance and $7,400. Besides, the 50% Fib retracement level of the last decline from the $8,213 high to $6,776 low is near the $7,500 level.
The key resistance is near the $7,550 level and a connecting bearish trend line on the same chart. A clear break above the $7,500 and $7,550 resistance levels could set the pace for more gains.
Bitcoin Price
Looking at the chart, bitcoin price is likely setting up for another breakdown below the $7,200 and $7,000 support levels. Conversely, a close above $7,550 is needed for a correction towards the $8,000 level in the coming days.
Technical indicators
4 hours MACD – The MACD for BTC/USD is slowly moving in the bullish zone.
4 hours RSI (Relative Strength Index) – The RSI for BTC/USD is now recovering, but it is well below the 40 level.
Major Support Level – $7,000
Major Resistance Level – $7,550
The post Bitcoin Weekly Forecast: BTC Aiming Key $6.5K Support appeared first on NewsBTC.
source https://www.tokentalk.co/NewsBTC/bitcoin-weekly-forecast-btc-aiming-key-65k-support-5dda04f1f699795d788cc629
Saturday, 23 November 2019
Bitcoin Weekly Forecast: BTC Aiming Key $6.5K Support @newsbtc #Analysis #Technical #bitcoin #btc
Subscribe to:
Post Comments (Atom)
This analyst says there’s a “high chance” Bitcoin may never fall under $5k again @cryptoslate #Analysis #Price Watch
Once Bitcoin (BTC) started to incur strong losses in the second half of 2019, analysts were once again making extremely low price prediction...

-
The Indian Ministry of Commerce and Industry announced yesterday that the Coffee Board in the country is integrating blockchain into the cof...
-
App-enabled cryptocurrency exchange and wallet provider, Zebpay, has announced that it is enabling Lightning Network payments for all its ...
-
Once Bitcoin (BTC) started to incur strong losses in the second half of 2019, analysts were once again making extremely low price prediction...


No comments:
Post a Comment