- Ethereum is down more than 5% and it broke the $130 support area against the US Dollar.
- The price is currently testing the $125 and $126 support levels, with a positive bias.
- Earlier, there was a...
- Ethereum is down more than 5% and it broke the $130 support area against the US Dollar.
- The price is currently testing the $125 and $126 support levels, with a positive bias.
- Earlier, there was a break below a contracting triangle with support near $132 on the hourly chart of ETH/USD (data feed via Kraken).
- Bitcoin is down around 4% and it is now trading below the $7,400 level.
Ethereum price is back to a key support zone versus the US Dollar and bitcoin. ETH price must stay above the $125 support to bounce back in the near term.
Ethereum Price Analysis
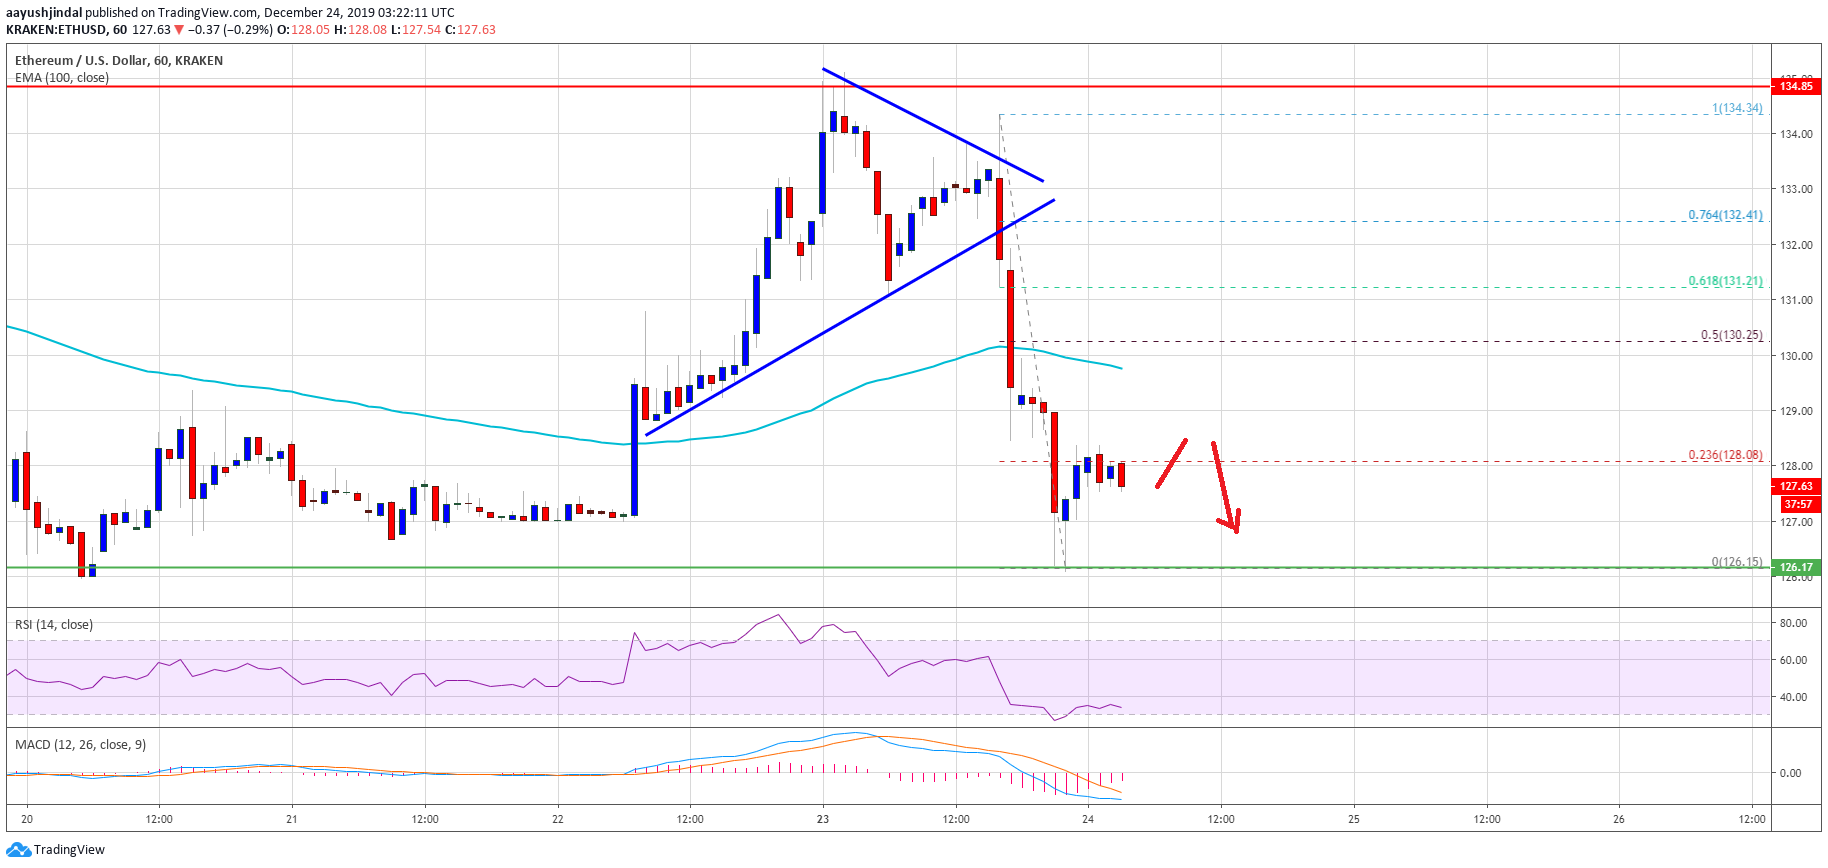
Yesterday, we saw a decent increase in Ethereum price above the $130 resistance against the US Dollar. Moreover, ETH price rallied above the 100 hourly simple moving average and $132.
However, the $135 level once again acted as a strong resistance. A swing high was formed near $135 and the price started a downside correction. The bears succeeded in surpassing the $132 and $130 support levels.
Besides, there was a break below a contracting triangle with support near $132 on the hourly chart of ETH/USD. The pair even traded below $128 and the 100 hourly simple moving average.
Finally, the price tested the main $125 and $126 support levels. A low is formed near $126 and the price is currently consolidating losses. It is trading near the 23.6% Fib retracement level of the recent drop from the $135 high to $126 low.
On the upside, the first key resistance is near the $130 level and the 100 hourly simple moving average. Additionally, the 50% Fib retracement level of the recent drop from the $135 high to $126 low is near the $130 level.
Therefore, a successful close above the $130 resistance is needed for a fresh increase. The next major resistance is near the $135 level, above which Ethereum price could rally towards the $140 and $142 levels.
On the other hand, the price could fail to recover above $128 and $130. On the downside, the $125 and $126 support levels are very important. If there is a downside break below the $125 support, the price could turn bearish and start a fresh decline.
Ethereum Price
Looking at the chart, Ethereum price is back to the key $125 support area. As long as it is above the $125 zone, there are chances of a fresh increase towards $130 and $135.
ETH Technical Indicators
Hourly MACD – The MACD for ETH/USD is slowly moving into the bullish zone.
Hourly RSI – The RSI for ETH/USD is now well below the 40 level, with negative signs.
Major Support Level – $125
Major Resistance Level – $130
The post Ethereum Down 5%, But Market Sentiment Is Still Positive appeared first on NewsBTC.
source https://www.tokentalk.co/NewsBTC/ethereum-down-5-but-market-sentiment-is-still-positive-5e0187a1be36ad783c13475c
Monday, 23 December 2019
Ethereum Down 5%, But Market Sentiment Is Still Positive @newsbtc #Analysis #Technical #ETH #ethereum
Subscribe to:
Post Comments (Atom)
This analyst says there’s a “high chance” Bitcoin may never fall under $5k again @cryptoslate #Analysis #Price Watch
Once Bitcoin (BTC) started to incur strong losses in the second half of 2019, analysts were once again making extremely low price prediction...

-
The Indian Ministry of Commerce and Industry announced yesterday that the Coffee Board in the country is integrating blockchain into the cof...
-
App-enabled cryptocurrency exchange and wallet provider, Zebpay, has announced that it is enabling Lightning Network payments for all its ...
-
Once Bitcoin (BTC) started to incur strong losses in the second half of 2019, analysts were once again making extremely low price prediction...


No comments:
Post a Comment