- Ethereum is holding the key $145 support area and recovering against the US Dollar.
- The price is currently facing a strong resistance near the $152 area.
- Earlier, there was a break above a major ...
- Ethereum is holding the key $145 support area and recovering against the US Dollar.
- The price is currently facing a strong resistance near the $152 area.
- Earlier, there was a break above a major bearish trend line with resistance near $150 on the hourly chart of ETH/USD (data feed via Kraken).
- The price remains well bid, but it might struggle to climb further above $152 and $155.
Ethereum price is facing an uphill task versus the US Dollar and bitcoin. ETH price must break the $152 and $155 resistance levels to continue higher.
Ethereum Price Analysis
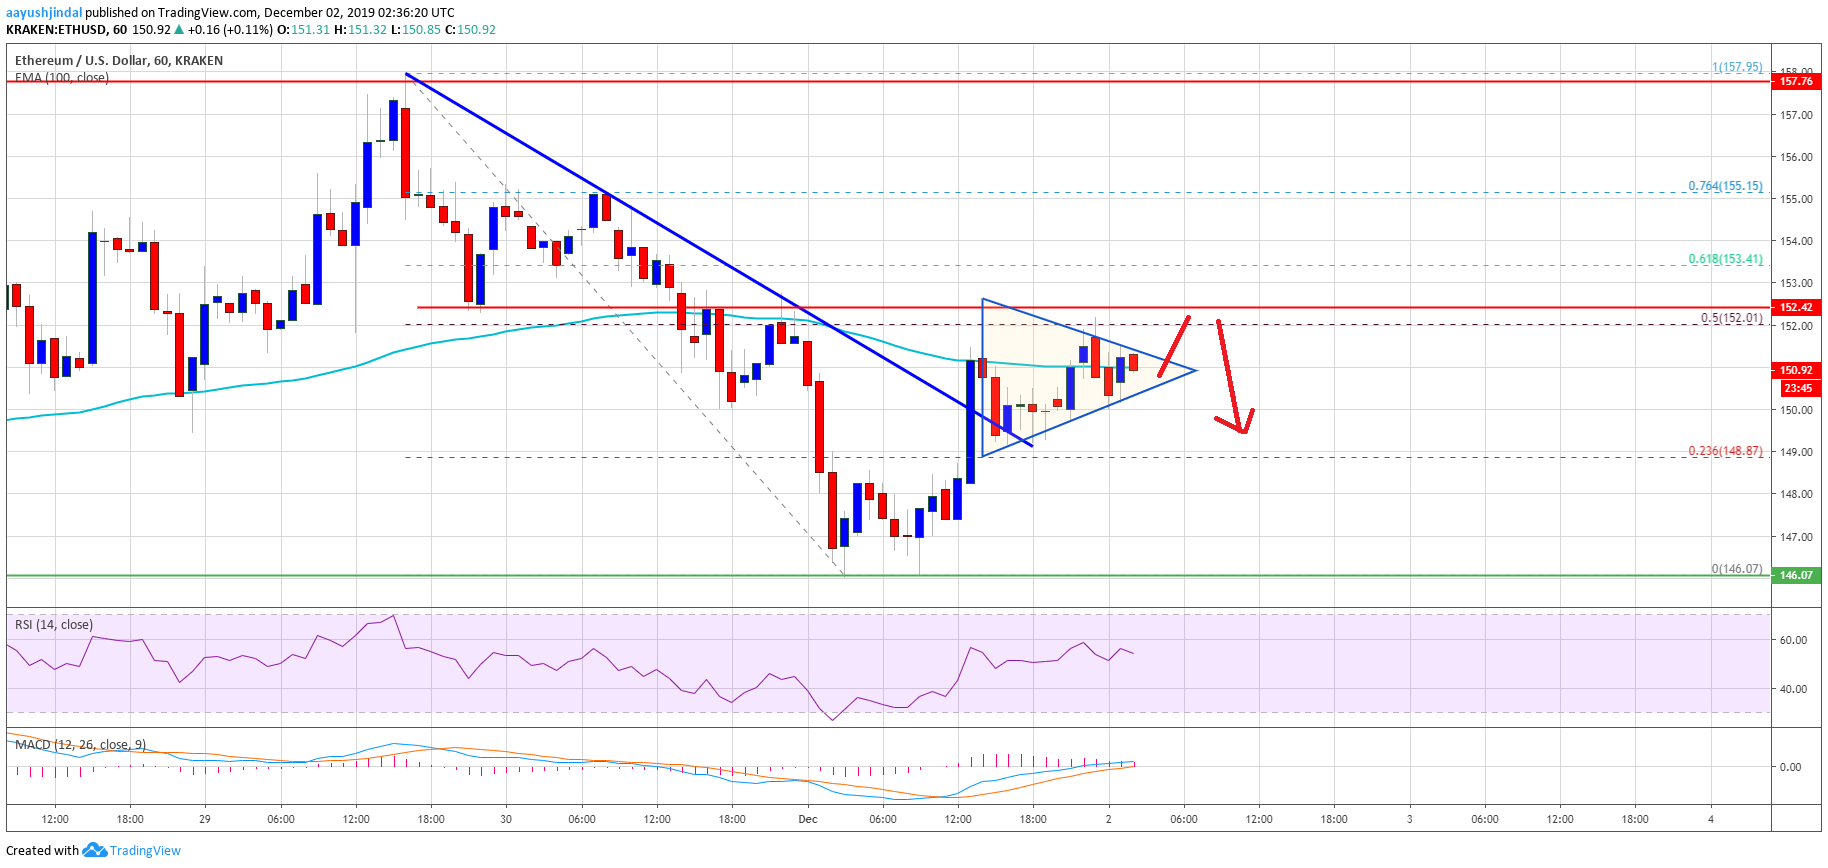
Recently, there was a downside correction in Ethereum from the $158 resistance area against the US Dollar. ETH price declined below the $152 support area and the 100 hourly simple moving average.
Moreover, the price broke the $150 support area and traded close to the $145 support. A low was formed near $146 and the price is currently recovering. It climbed above the $148 resistance level.
Besides, there was a break above the 23.6% Fib retracement level of the latest decline from the $158 high to $146 low. More importantly, there was a break above a major bearish trend line with resistance near $150 on the hourly chart of ETH/USD.
However, the $152 support area and the 100 hourly simple moving average are now acting as hurdles. Additionally, the 50% Fib retracement level of the latest decline from the $158 high to $146 low is acting as a resistance.
Ethereum price is now trading inside a contracting triangle with resistance near the $151 level on the same chart. Therefore, an upside break above the $151 and $152 levels might push the price further higher.
The next key resistance is near the $155 level, above which it could rise towards the main $158 resistance area. Conversely, the price could fail to continue higher and decline below $148.
An immediate support is near the $146 and $145 levels. Any further losses might push the price into a bearish zone towards the $140 and $138 levels. The main support is near the last month low near $132.
Ethereum Price
Looking at the chart, Ethereum price is showing a few bearish signs below the $152 and $155 resistance levels. Having said that, the price must clear the $158 hurdle to move into a medium term uptrend. If not, it may perhaps resume its decline below the $145 and $140 levels.
ETH Technical Indicators
Hourly MACD – The MACD for ETH/USD is losing gaining pace in the bullish zone.
Hourly RSI – The RSI for ETH/USD is currently above the 50 level and it could decline again.
Major Support Level – $146
Major Resistance Level – $152
The post Ethereum (ETH) Setting For Breakout or Further Decline? appeared first on NewsBTC.
source https://www.tokentalk.co/NewsBTC/ethereum-eth-setting-for-breakout-or-further-decline-5de47e30713a48c87bb9d25d
Sunday, 1 December 2019
Ethereum (ETH) Setting For Breakout or Further Decline? @newsbtc #Analysis #Technical #ETH #ethereum
Subscribe to:
Post Comments (Atom)
This analyst says there’s a “high chance” Bitcoin may never fall under $5k again @cryptoslate #Analysis #Price Watch
Once Bitcoin (BTC) started to incur strong losses in the second half of 2019, analysts were once again making extremely low price prediction...

-
The Indian Ministry of Commerce and Industry announced yesterday that the Coffee Board in the country is integrating blockchain into the cof...
-
App-enabled cryptocurrency exchange and wallet provider, Zebpay, has announced that it is enabling Lightning Network payments for all its ...
-
Once Bitcoin (BTC) started to incur strong losses in the second half of 2019, analysts were once again making extremely low price prediction...


No comments:
Post a Comment