- Ripple price is down close to 6% and it broke the $0.2050 support area against the US dollar.
- The price is likely to continue lower below $0.2000 and $0.1980 in the near term.
- Earlier, there was ...
- Ripple price is down close to 6% and it broke the $0.2050 support area against the US dollar.
- The price is likely to continue lower below $0.2000 and $0.1980 in the near term.
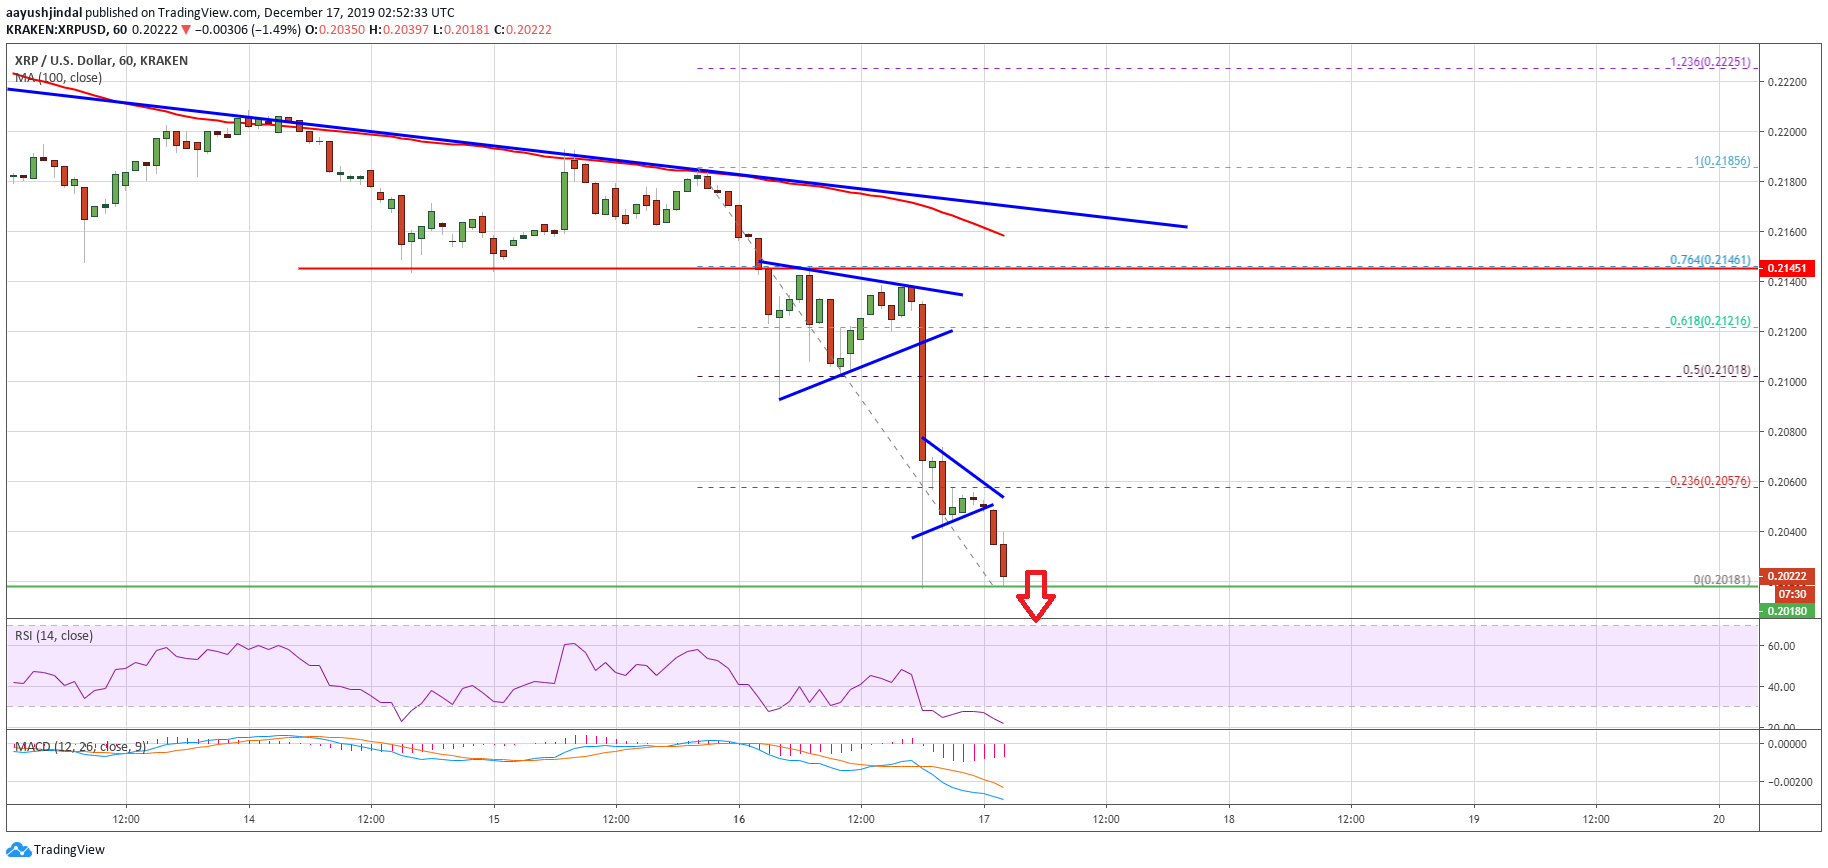
- Earlier, there was a break below a couple of bearish continuation patterns with support near $0.2120 and $0.2050 on the hourly chart of the XRP/USD pair (data source from Kraken).
- Ethereum is also down more than 6% and it is now trading near the $130 support.
Ripple price is declining heavily against the US Dollar and bitcoin. XRP price remains at a risk of another landslide below the $0.2000 support area.
Ripple Price Analysis
In the past few hours, there was a strong bearish wave in ripple, Ethereum, EOS, and a few other altcoins against the US Dollar. XRP price broke the main $0.2150 and $0.2120 support levels to move further into a bearish zone.
Furthermore, there was a close below $0.2100 and the 100 hourly simple moving average. The price even spiked below the $0.2050 support.
More importantly, there was a break below a couple of bearish continuation patterns with support near $0.2120 and $0.2050 on the hourly chart of the XRP/USD pair. The pair traded close to the $0.2000 support area and the recent low is near $0.2018.
The current price action suggests very less chances of an upside correction above $0.2040 in the short term. The first key resistance is near the $0.2050 level. It is near the 23.6% Fib retracement level of the recent slide from the $0.2185 high to $0.2018 low.
If ripple price corrects above the $0.2050 and $0.2060 levels, there are chances of further gains. The next major resistance is near the $0.2100 area. Moreover, the 50% Fib retracement level of the recent slide from the $0.2185 high to $0.2018 low is also near $0.2108.
Conversely, the price could continue to slide below the $0.2020 and $0.2000 support levels. In the mentioned bearish case, the price is likely to slide below the $0.1980 support area. The next major support is near the $0.1960 level.
Ripple Price
Looking at the chart, ripple price is down and out below the $0.2100 level. The price action is super bearish and suggesting more losses below the $0.2000 support. Additionally, if bitcoin and Ethereum continues to slide, XRP is likely to follow.
Technical Indicators
Hourly MACD – The MACD for XRP/USD is currently gaining strength in the bearish zone.
Hourly RSI (Relative Strength Index) – The RSI for XRP/USD is still declining into the oversold area.
Major Support Levels – $0.2020, $0.2000 and $0.1960.
Major Resistance Levels – $0.2050, $0.2060 and $0.2100.
The post Ripple (XRP) Landslide To Continue: ETH Down 6%, BTC Breaks $7K appeared first on NewsBTC.
source https://www.tokentalk.co/NewsBTC/ripple-xrp-landslide-to-continue-eth-down-6-btc-breaks-7k-5df857715b9a244c229edc63
Monday, 16 December 2019
Ripple (XRP) Landslide To Continue: ETH Down 6%, BTC Breaks $7K @newsbtc #Analysis #Technical #Ripple #xrp
Subscribe to:
Post Comments (Atom)
This analyst says there’s a “high chance” Bitcoin may never fall under $5k again @cryptoslate #Analysis #Price Watch
Once Bitcoin (BTC) started to incur strong losses in the second half of 2019, analysts were once again making extremely low price prediction...

-
The Indian Ministry of Commerce and Industry announced yesterday that the Coffee Board in the country is integrating blockchain into the cof...
-
App-enabled cryptocurrency exchange and wallet provider, Zebpay, has announced that it is enabling Lightning Network payments for all its ...
-
Once Bitcoin (BTC) started to incur strong losses in the second half of 2019, analysts were once again making extremely low price prediction...


No comments:
Post a Comment