- Bitcoin price remained in a bearish zone and even dropped below $10,000 against the US Dollar.
- The price is now trading well below the $10,200 level and it could continue to slide.
- There is a key...
- Bitcoin price remained in a bearish zone and even dropped below $10,000 against the US Dollar.
- The price is now trading well below the $10,200 level and it could continue to slide.
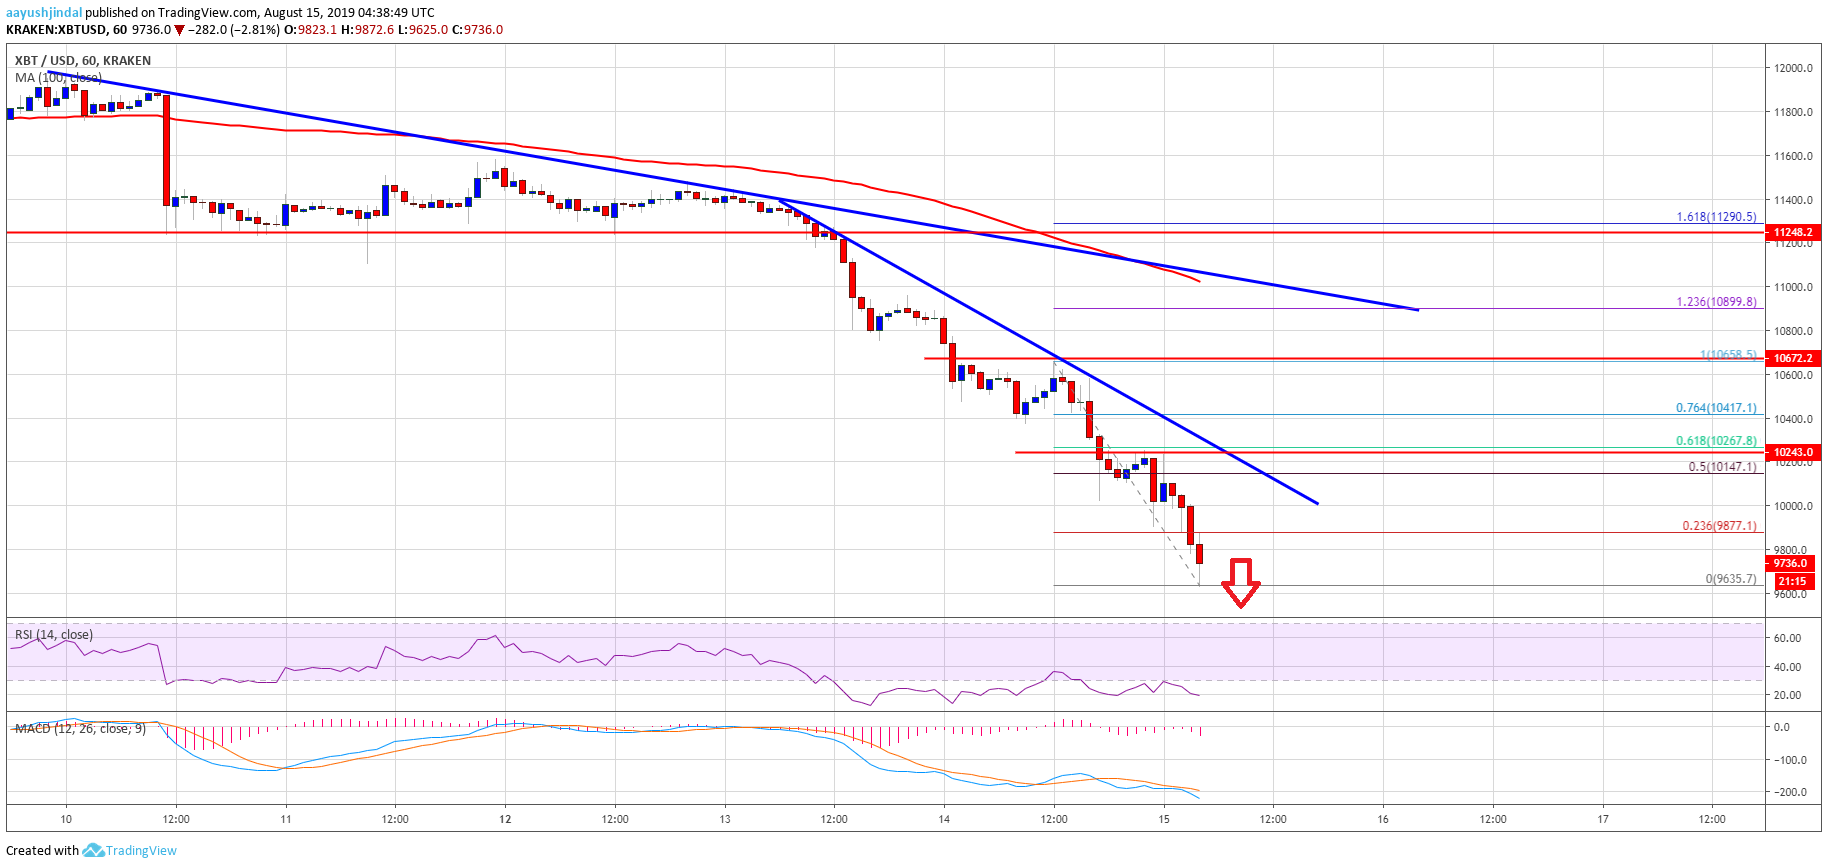
- There is a key bearish trend line forming with resistance near $10,150 on the hourly chart of the BTC/USD pair (data feed from Kraken).
- The price is under a lot of pressure and it could even test the $9,500 support area.
Bitcoin price is trading a crucial downtrend below $10,200 against the US Dollar. BTC price tested the final bearish target of $10,000, as discussed in the weekly forecast.
Bitcoin Price Analysis
Yesterday, bitcoin price tested the $10,500 support level (this week’s bearish target) against the US Dollar. Later, the BTC/USD pair extended losses and broke a couple of important supports near $10,400 and $10,200. Moreover, there was a break below the $10,000 support and the price settled well below the 100 hourly simple moving average. Finally, the price traded below $9,800 and a new monthly low was formed near $9,635.
The price is currently trading in a strong downtrend below $10,000. An immediate resistance is near the $9,880 level plus the 23.6% Fib retracement level of the recent slide from the $10,658 high to $9,635 low. However, the main resistances on the upside are near $10,000, $10,100 and $10,200. Moreover, there is a key bearish trend line forming with resistance near $10,150 on the hourly chart of the BTC/USD pair.
The 50% Fib retracement level of the recent slide from the $10,658 high to $9,635 low is also waiting near the $10,150 level to act as a resistance. Therefore, an upside correction above the $9,880 level is likely to face sellers near the $10,000 and $10,200 levels. To start a strong recovery, the price has to climb above the $10,200 resistance and gain strength above $10,250.
On the downside, the recent low at $9,635 is an immediate support. If there are more losses, the price could extend its decline towards the $9,500 support level. More importantly, the bears could target the $9,200 support area in the coming sessions.
Looking at the chart, bitcoin price is placed in a strong downtrend below the $10,000 and $10,200 levels. If there is a weekly close below $10,000, the price could accelerate losses in the coming days. On the upside, a convincing follow through above $10,250 might set the pace for a recovery towards the $11,000 level.
Technical indicators:
Hourly MACD – The MACD is currently gaining pace in the bearish zone.
Hourly RSI (Relative Strength Index) – The RSI for BTC/USD is currently near the 20 level.
Major Support Levels – $9,650 followed by $9,500.
Major Resistance Levels – $10,000, $10,100 and $10,200.
The post Bitcoin (BTC) Price Final Target But Decline Far From Over appeared first on NewsBTC.
source https://www.tokentalk.co/NewsBTC/bitcoin-btc-price-final-target-but-decline-far-from-over-5d54f3f16fe5556e3f947452
Wednesday, 14 August 2019
Bitcoin (BTC) Price Final Target But Decline Far From Over @newsbtc #Analysis #Technical #bitcoin #btc
Subscribe to:
Post Comments (Atom)
This analyst says there’s a “high chance” Bitcoin may never fall under $5k again @cryptoslate #Analysis #Price Watch
Once Bitcoin (BTC) started to incur strong losses in the second half of 2019, analysts were once again making extremely low price prediction...

-
The Indian Ministry of Commerce and Industry announced yesterday that the Coffee Board in the country is integrating blockchain into the cof...
-
App-enabled cryptocurrency exchange and wallet provider, Zebpay, has announced that it is enabling Lightning Network payments for all its ...
-
Ripple price climbed higher recently above the $0.2450 and $0.2500 resistances against the US dollar. The price is currently trading near ...


No comments:
Post a Comment