- There was a major downward move below the $10,000 support in bitcoin price against the US Dollar.
- The price is currently correcting higher, but upsides remain capped near $9,800 and $10,000.
- Ther...
- There was a major downward move below the $10,000 support in bitcoin price against the US Dollar.
- The price is currently correcting higher, but upsides remain capped near $9,800 and $10,000.
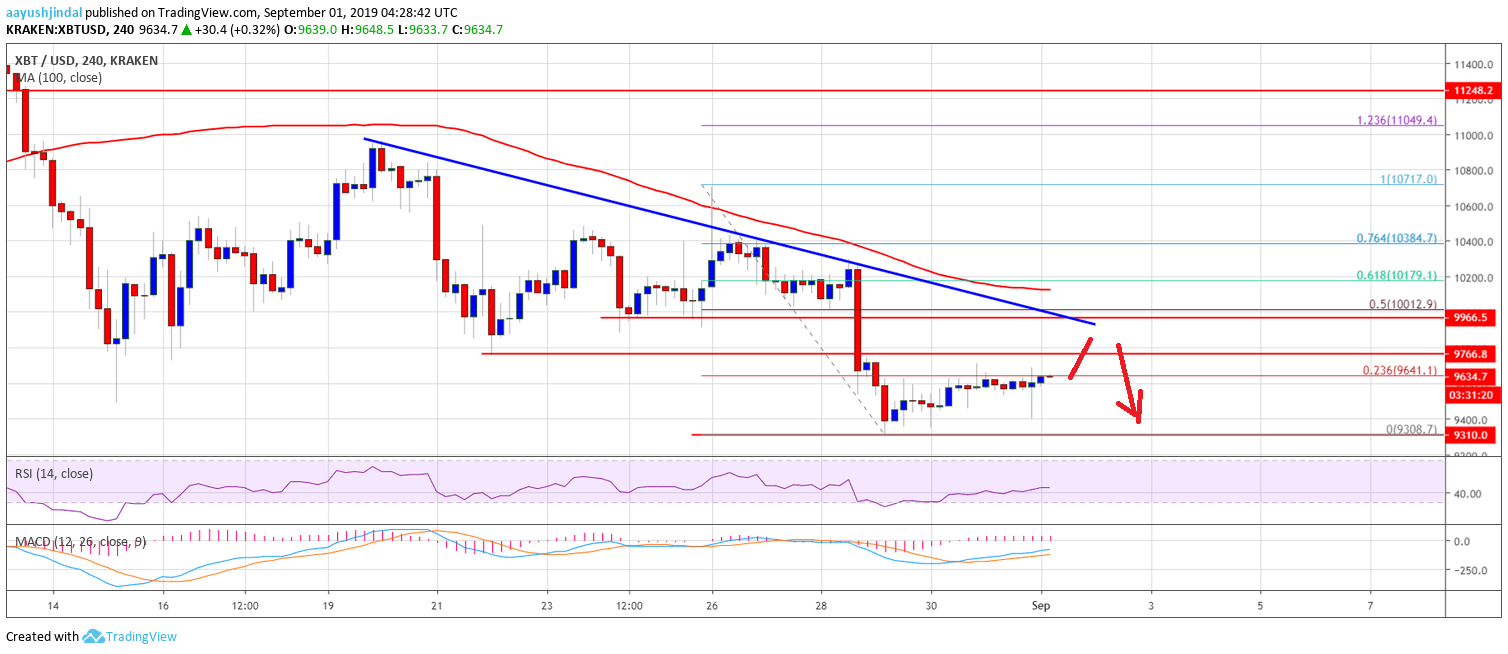
- There is a major bearish trend line forming with resistance near $9,980 on the 4-hours chart of the BTC/USD pair (data feed from Kraken).
- There could be a short term upside correction, but the bulls are likely to struggle near $10,000.
Bitcoin price is facing a lot of hurdles on the upside near $10,000 against the US Dollar. BTC remains sell on rallies as long as it is trading below the $10,000 resistance.
Bitcoin Price Weekly Analysis (BTC)
In the last weekly forecast, we discussed the possibilities of a downward move below $10,000 in bitcoin price against the US Dollar. The BTC/USD pair did move down and broke the key $10,000 and $9,800 support levels. Moreover, there was a close below the $10,000 pivot and the 100 simple moving average (4-hours). Finally, there was a break below the $9,800 and $9,500 supports as well.
A new monthly low was formed near $9,300 and the price is currently consolidating losses. It is testing the 23.6% Fib retracement level of the recent decline from the $10,717 high to $9,308 low. However, there are many hurdles on the upside near the $9,800 and $9,900 levels. Additionally, there is a major bearish trend line forming with resistance near $9,980 on the 4-hours chart of the BTC/USD pair.
Moreover, the 50% Fib retracement level of the recent decline from the $10,717 high to $9,308 low is also near the $10,010 level. Therefore, upsides are likely to remain capped near the $9,800 and $10,000 levels. Above the trend line, the 100 SMA is waiting near the $10,150 level. The 61.8% Fib retracement level of the recent decline from the $10,717 high to $9,308 low is also waiting near the $10,170 level.
On the downside, an immediate support is near the $9,500 level. If there is a downside break below the $9,500 support, the price may continue to move down below the last swing low at $9,300. The next key supports are near the $9,100 and $9,000 levels.
Looking at the chart, bitcoin price is clearly trading in a downtrend below $10,000. In the short term, there could be an upside correction, but the $9,800 and $10,000 levels are likely to act as major sell zones in the coming sessions.
Technical indicators
4 hours MACD – The MACD for BTC/USD is slowly moving into the bullish zone.
4 hours RSI (Relative Strength Index) – The RSI for BTC/USD is slowly rising towards the 50 level.
Major Support Level – $9,500
Major Resistance Level – $10,000
The post Bitcoin (BTC) Price Weekly Forecast: $10K Holds Key For Recovery appeared first on NewsBTC.
source https://www.tokentalk.co/NewsBTC/bitcoin-btc-price-weekly-forecast-10k-holds-key-for-recovery-5d6b4f61b98396a4770c96e7
Saturday, 31 August 2019
Bitcoin (BTC) Price Weekly Forecast: $10K Holds Key For Recovery @newsbtc #Analysis #Technical #bitcoin #btc
Subscribe to:
Post Comments (Atom)
This analyst says there’s a “high chance” Bitcoin may never fall under $5k again @cryptoslate #Analysis #Price Watch
Once Bitcoin (BTC) started to incur strong losses in the second half of 2019, analysts were once again making extremely low price prediction...

-
The Indian Ministry of Commerce and Industry announced yesterday that the Coffee Board in the country is integrating blockchain into the cof...
-
App-enabled cryptocurrency exchange and wallet provider, Zebpay, has announced that it is enabling Lightning Network payments for all its ...
-
Disclaimer: These summaries are provided for educational purposes only by Nelson Rosario and Stephen Palley... Disclaimer: These summaries...

No comments:
Post a Comment