- Ripple price is following a bearish path below the $0.2800 and $0.2900 resistances against the US dollar.
- There are many supports on the downside such as $0.2640, $0.2580 and $0.2500.
- There is a ...
- Ripple price is following a bearish path below the $0.2800 and $0.2900 resistances against the US dollar.
- There are many supports on the downside such as $0.2640, $0.2580 and $0.2500.
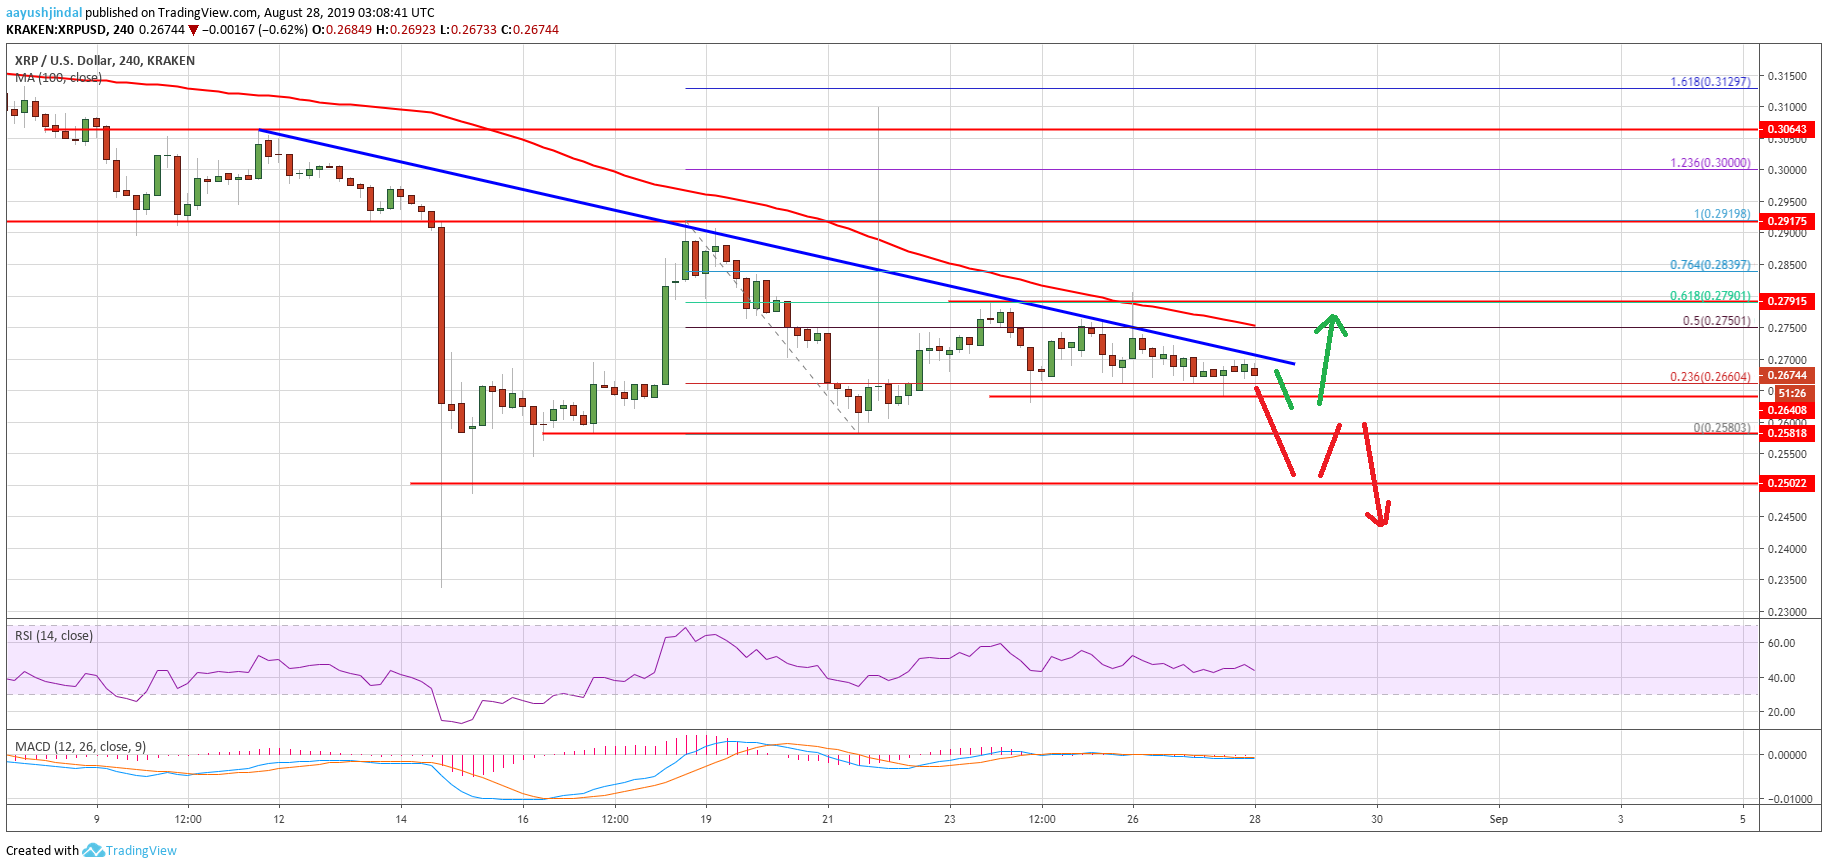
- There is a crucial bearish trend line forming with resistance near $0.2700 on the 4-hours chart of the XRP/USD pair (data source from Kraken).
- The price could either climb above $0.2800 or decline heavily below $0.2500 in the near term.
Ripple price is facing a lot of hurdles against the US Dollar and bitcoin. XRP price seems to be preparing for a larger wave either above $0.2800 or below $0.2500.
Ripple Price Analysis
In the past few days, there was a slow and steady decline in bitcoin, Ethereum and XRP against the US Dollar. After testing the key $0.2900 and $0.2920 resistance levels, ripple started a fresh decline. It broke the $0.2800 support level to move back into a bearish zone. Moreover, there was a close below the $0.2750 level and the 100 simple moving average (4-hours).
It opened the doors for more downsides below the $0.2650 support. Finally, the price tested the $0.2580 level and traded as low as $0.2581. Later, the price started an upside correction above the $0.2650 and $0.2700 level. Moreover, there was a break above the 50% Fib retracement level of the major decline from the $0.2919 high to $0.2580 low.
However, the upward move was capped by the $0.2800 resistance level. Additionally, the 61.8% Fib retracement level of the major decline from the $0.2919 high to $0.2580 low acted as a strong resistance. More importantly, there is a crucial bearish trend line forming with resistance near $0.2700 on the 4-hours chart of the XRP/USD pair. Ripple is now following a bearish path below the $0.2800 and $0.2900 resistances.
There are two possible scenarios – bullish above $0.2800 or bearish below $0.2500. If there is an upside break above $0.2800 and $0.2900, the price could start a strong upward move. The next stops for the bulls might be $0.2920, $0.3000 and $0.3120. Conversely, a downside break below $0.2580 and $0.2500 could accelerate losses in the coming days.
Looking at the chart, ripple price is clearly struggling to gain bullish momentum above $0.2750 and $0.2800. However, there are many supports near $0.2580 and $0.2500. Overall, the next key break is near and the price could either surge or decline heavily below $0.2500.
Technical Indicators
Hourly MACD – The MACD for XRP/USD is slowly moving into the bearish zone.
Hourly RSI (Relative Strength Index) – The RSI for XRP/USD is currently below 50 and is moving lower towards 40.
Major Support Levels – $0.2640, $0.2580 and $0.2500.
Major Resistance Levels – $0.2750, $0.2800 and $0.2920.
The post Ripple Price (XRP) Possible Scenarios and Bigger Picture appeared first on NewsBTC.
source https://www.tokentalk.co/NewsBTC/ripple-price-xrp-possible-scenarios-and-bigger-picture-5d65fd302acedc681ba2ef39
Wednesday, 28 August 2019
Ripple Price (XRP) Possible Scenarios and Bigger Picture @newsbtc #Analysis #Technical #Ripple #xrp
Subscribe to:
Post Comments (Atom)
This analyst says there’s a “high chance” Bitcoin may never fall under $5k again @cryptoslate #Analysis #Price Watch
Once Bitcoin (BTC) started to incur strong losses in the second half of 2019, analysts were once again making extremely low price prediction...

-
The Indian Ministry of Commerce and Industry announced yesterday that the Coffee Board in the country is integrating blockchain into the cof...
-
App-enabled cryptocurrency exchange and wallet provider, Zebpay, has announced that it is enabling Lightning Network payments for all its ...
-
Disclaimer: These summaries are provided for educational purposes only by Nelson Rosario and Stephen Palley... Disclaimer: These summaries...

No comments:
Post a Comment