- Ripple price recovered recently, but it failed to break the $0.2600 resistance area against the US dollar.
- The price is currently moving lower and remains at a risk of more downsides below $0.2500.
- <...
- Ripple price recovered recently, but it failed to break the $0.2600 resistance area against the US dollar.
- The price is currently moving lower and remains at a risk of more downsides below $0.2500.
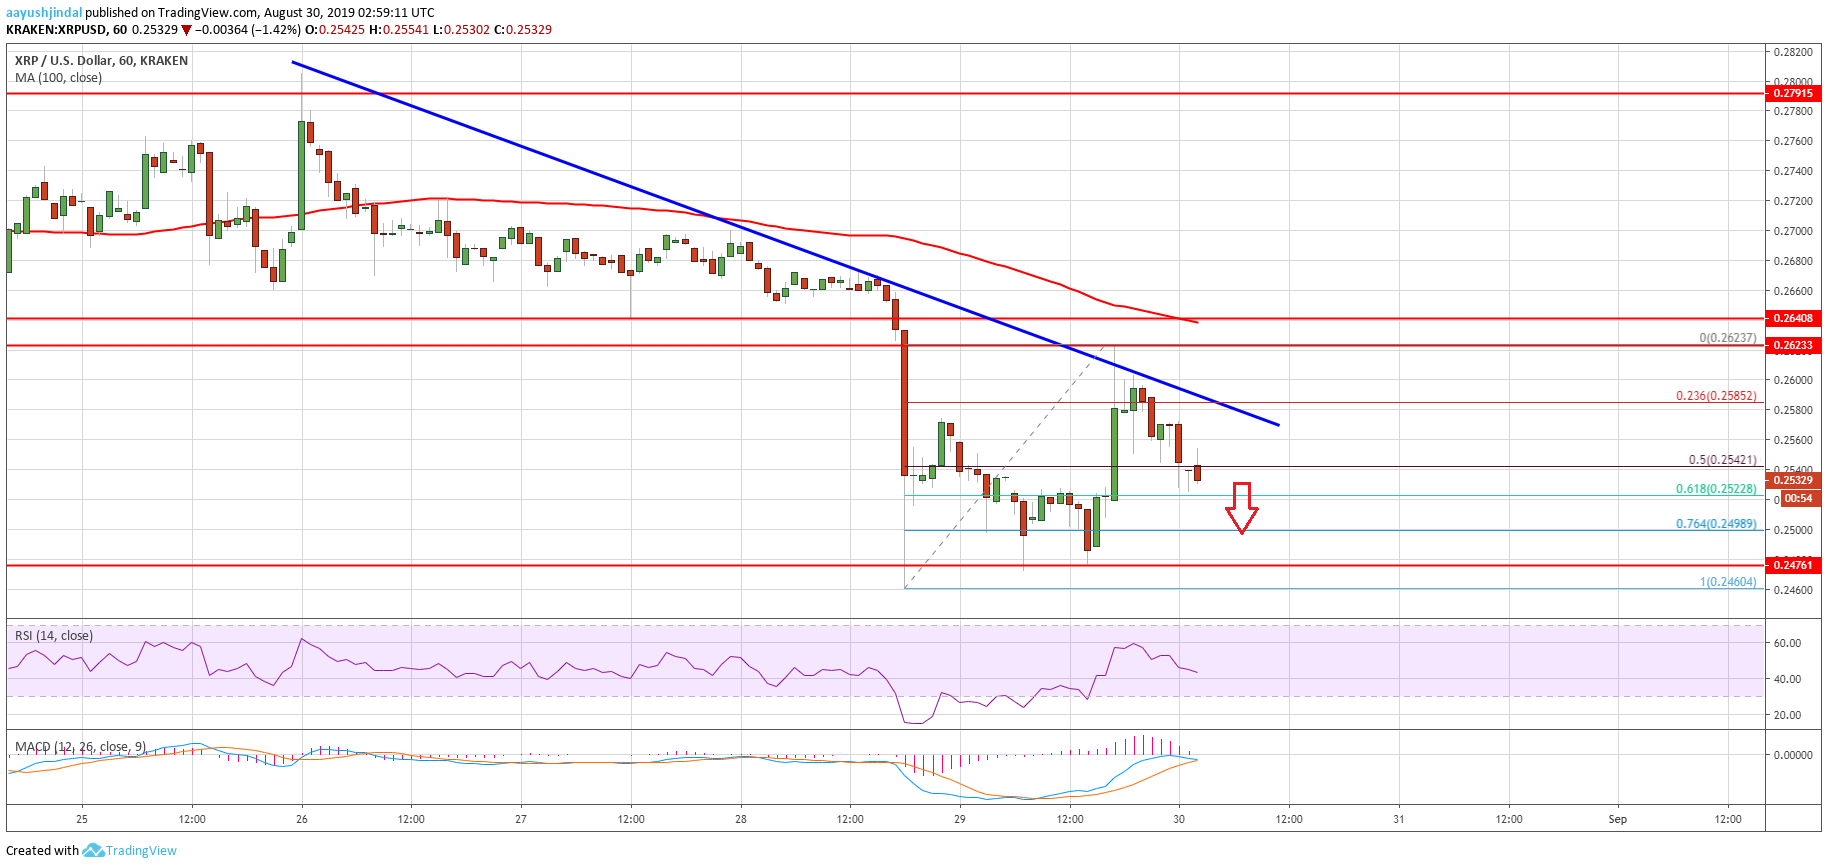
- Yesterday’s highlighted major bearish trend line is active with resistance near $0.2580 on the hourly chart of the XRP/USD pair (data source from Kraken).
- The current technical structure suggests more downsides as long as the price is below $0.2620.
Ripple price is gaining bearish momentum against the US Dollar and bitcoin. XRP price could trade to a new monthly low if it continues to struggle below $0.2600.
Ripple Price Analysis
Yesterday, there was a sharp decline in ripple below the $0.2600 and $0.2580 supports against the US Dollar. The bears took control and pushed the price below the $0.2500 support level. Moreover, the price settled below the 100 hourly simple moving average and traded to a new monthly low at $0.2460. Recently, there was an upside correction above the $0.2500 and $0.2520 levels.
The price traded above the $0.2580 resistance level as well. However, the $0.2600 and $0.2620 resistance levels acted as key barriers. Finally, the price topped near $0.2623 and it is currently moving lower. Ripple is trading below the $0.2550 level plus the 50% Fib retracement level of the recent wave from the $0.2460 low to $0.2623 high. An immediate support on the downside is near the $0.2520 level.
Additionally, the 61.8% Fib retracement level of the recent wave from the $0.2460 low to $0.2623 high is also near the $0.2520 level. Therefore, a downside break below the $0.2520 support may accelerate decline. The next stop for the bears could be near the last swing low at $0.2460. More importantly, the price may perhaps continue to move down towards the $0.2420 and $0.2400 supports.
On the upside, there is a major resistance forming near the $0.2580 and $0.2600 levels. Besides, yesterday’s highlighted major bearish trend line is active with resistance near $0.2580 on the hourly chart of the XRP/USD pair. Therefore, it won’t be easy for the bulls to push the price above the $0.2580 and $0.2600 resistances.
Looking at the chart, ripple price is clearly struggling to continue higher above $0.2580 and $0.2600. On the downside, a clear break below $0.2520 and $0.2500 is likely to push the price further lower. The bears are likely to target the $0.2420 and $0.2400 support levels in the near term.
Technical Indicators
Hourly MACD – The MACD for XRP/USD is about to move back into the bearish zone.
Hourly RSI (Relative Strength Index) – The RSI for XRP/USD is holding the 40 level, with a minor bullish angle.
Major Support Levels – $0.2520, $0.2500 and $0.2450.
Major Resistance Levels – $0.2580, $0.2600 and $0.2620.
The post Ripple Price (XRP) Showing Signs of Further Weakness appeared first on NewsBTC.
source https://www.tokentalk.co/NewsBTC/ripple-price-xrp-showing-signs-of-further-weakness-5d68a0303d0b939a25260322
Thursday, 29 August 2019
Ripple Price (XRP) Showing Signs of Further Weakness @newsbtc #Analysis #Technical #Ripple #xrp
Subscribe to:
Post Comments (Atom)
This analyst says there’s a “high chance” Bitcoin may never fall under $5k again @cryptoslate #Analysis #Price Watch
Once Bitcoin (BTC) started to incur strong losses in the second half of 2019, analysts were once again making extremely low price prediction...

-
The Indian Ministry of Commerce and Industry announced yesterday that the Coffee Board in the country is integrating blockchain into the cof...
-
App-enabled cryptocurrency exchange and wallet provider, Zebpay, has announced that it is enabling Lightning Network payments for all its ...
-
Disclaimer: These summaries are provided for educational purposes only by Nelson Rosario and Stephen Palley... Disclaimer: These summaries...

No comments:
Post a Comment