- Bitcoin price climbed higher sharply above $10,200 and gained around 5% against the US Dollar.
- The price is clearly struggling to gain strength above the key $10,500 resistance area.
- There was a ...
- Bitcoin price climbed higher sharply above $10,200 and gained around 5% against the US Dollar.
- The price is clearly struggling to gain strength above the key $10,500 resistance area.
- There was a break above a key bearish trend line with resistance near $10,270 on the hourly chart of the BTC/USD pair (data feed from Kraken).
- The price is correcting gains and it is testing the broken trend line and the $10,250 support.
Bitcoin price is showing signs of a decent recovery above $10,200 against the US Dollar. However, BTC is still trading well below the main $10,500 resistance area.
Bitcoin Price Analysis
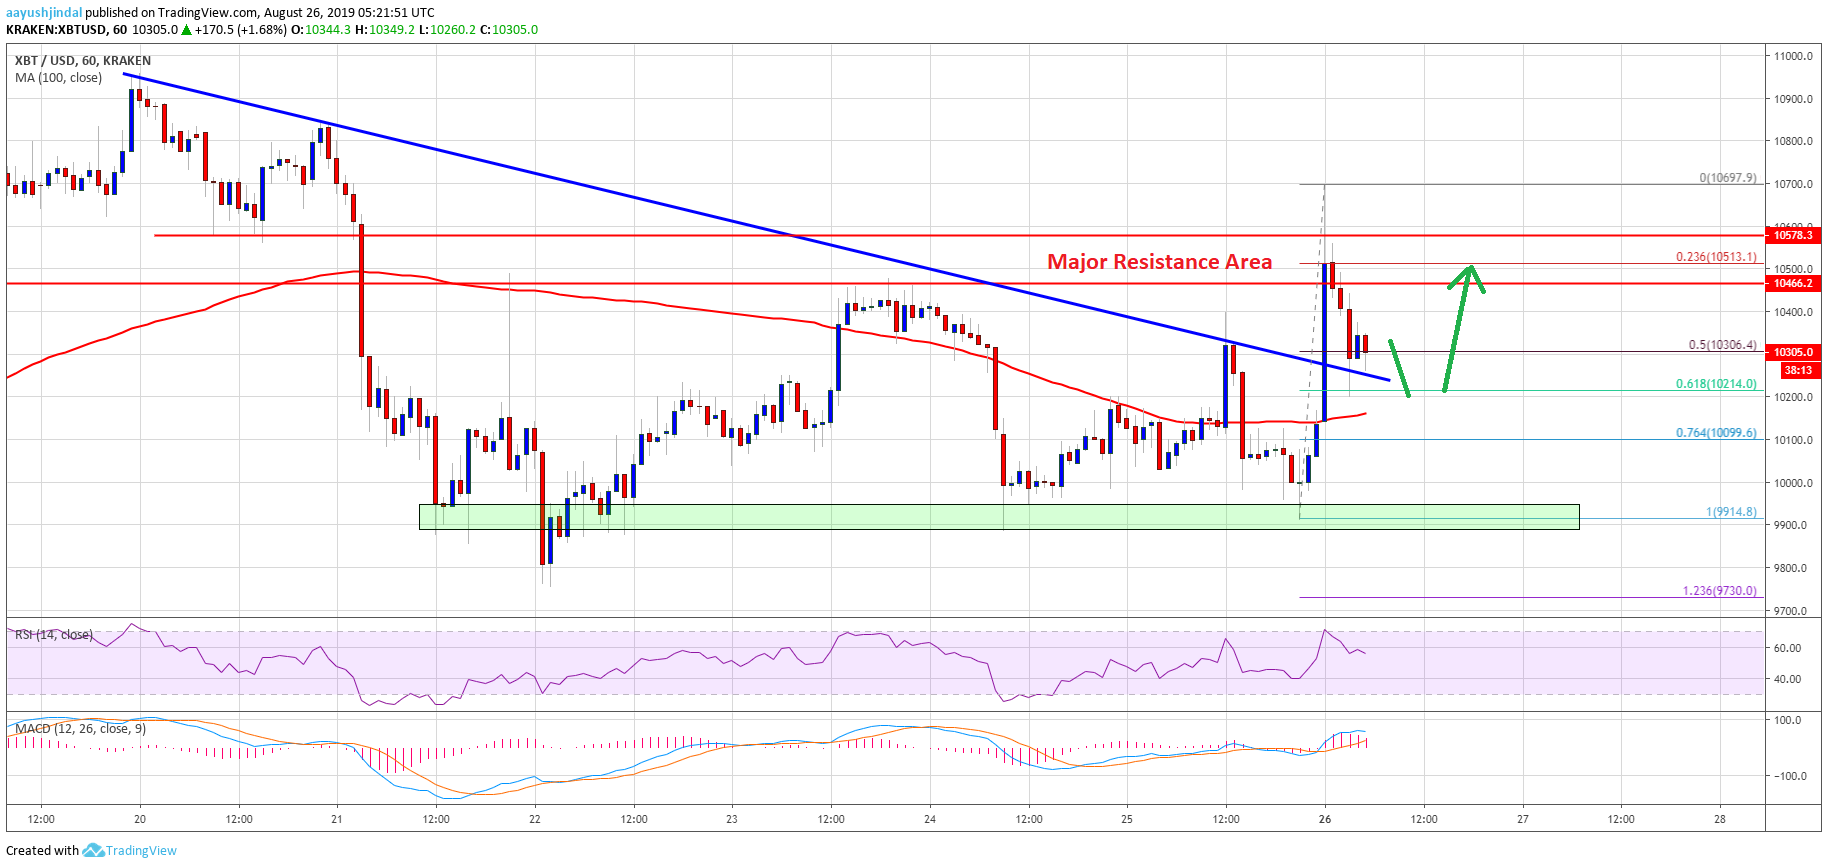
After forming a decent support near $9,900, BTC started an upside correction against the US Dollar. The price traded above the $10,000 and $10,200 resistance levels to move into a short term positive zone. Moreover, there was a break above the $10,300 level and the 100 hourly simple moving average. However, the price struggled to gain momentum above the key $10,500 resistance level (as discussed in the weekly forecast).
During the rise, there was a break above a key bearish trend line with resistance near $10,270 on the hourly chart of the BTC/USD pair. Bitcoin spiked towards the $10,700 level and formed a swing high near $10,697. At the moment, the price is correcting lower and is trading well below $10,500. It broke the $10,400 level and tested the 50% Fib retracement level of the recent rise from the $9,914 low to $10,697 high.
It seems like the $10,250 level and the broken trend line is acting as a support. The next key support is near the $10,200 level. It represents the 61.8% Fib retracement level of the recent rise from the $9,914 low to $10,697 high. The main support is near the $10,100 level and the 100 hourly simple moving average. If the price fails to recover again, there could be a fresh decline towards the $10,000 and $9,900 levels.
On the upside, the price must settle above $10,500 to gain bullish momentum. In the mentioned case, the next stop for the bulls could be $10,700 and $10,800. However, if the price accelerates above $10,500, it could aim to test the $11,000 level.
Looking at the chart, bitcoin price is clearly struggling near the $10,500 resistance. Therefore, if there is a downside break below the $10,200 support, the price is likely to revisit the $9,900 and $9,800 support levels.
Technical indicators:
Hourly MACD – The MACD is slowly losing pace in the bullish zone.
Hourly RSI (Relative Strength Index) – The RSI for BTC/USD is currently just above the 50 level.
Major Support Levels – $10,250 followed by $10,000.
Major Resistance Levels – $10,400, $10,500 and $10,680.
The post Bitcoin (BTC) Price Flirts With Key Resistance After Recent Rally appeared first on NewsBTC.
source https://www.tokentalk.co/NewsBTC/bitcoin-btc-price-flirts-with-key-resistance-after-recent-rally-5d6374712acedc681ba2ee9e
Monday, 26 August 2019
Bitcoin (BTC) Price Flirts With Key Resistance After Recent Rally @newsbtc #Analysis #Technical #bitcoin #btc
Subscribe to:
Post Comments (Atom)
This analyst says there’s a “high chance” Bitcoin may never fall under $5k again @cryptoslate #Analysis #Price Watch
Once Bitcoin (BTC) started to incur strong losses in the second half of 2019, analysts were once again making extremely low price prediction...

-
The Indian Ministry of Commerce and Industry announced yesterday that the Coffee Board in the country is integrating blockchain into the cof...
-
App-enabled cryptocurrency exchange and wallet provider, Zebpay, has announced that it is enabling Lightning Network payments for all its ...
-
Disclaimer: These summaries are provided for educational purposes only by Nelson Rosario and Stephen Palley... Disclaimer: These summaries...

No comments:
Post a Comment