- Bitcoin price is down more than 5% and it recently broke the key $9,760 support against the US Dollar.
- The price is currently consolidating near the $9,500 support and remains at a risk of more losses.
- Bitcoin price is down more than 5% and it recently broke the key $9,760 support against the US Dollar.
- The price is currently consolidating near the $9,500 support and remains at a risk of more losses.
- This week’s followed bearish flag was breached with support near $10,000 on the hourly chart of the BTC/USD pair (data feed from Kraken).
- The price is likely to extend its decline below the $9,500 and $9,480 support levels in the coming sessions.
Bitcoin price fell sharply below the $10,000 and $9,800 supports against the US Dollar. BTC price is currently at a risk of more downsides below the $9,500 support.
Bitcoin Price Analysis
In the past two days, we saw many bearish signs for BTC below the $10,500 support against the US Dollar. Finally, there was a bearish breakdown below the key $10,200 and $10,000 support levels. Additionally, there was a close below the $10,000 support and the 100 hourly simple moving average. More importantly, there were heavy downsides in Ethereum, ripple, binance coin, EOS and litecoin.
Bitcoin price is down around 5% in the past few hours and it even broke the $9,800 and $9,760 support level. Moreover, this week’s followed bearish flag was breached with support near $10,000 on the hourly chart of the BTC/USD pair. It traded to a new weekly low at $9,533 and it is currently consolidating above the $9,500 support area. Recently, there was an upside correction above the $9,600 level.
However, the upward move was capped by the $9,720 level plus the 23.6% Fib retracement level of the recent drop from the $10,304 high to $9,533 low. The price is currently struggling to recover above the $9,650 and $9,700. Above these, the next key resistance is near the $10,000 level. The 50% Fib retracement level of the recent drop from the $10,304 high to $9,533 low is also near the $9,920 level to act as a resistance.
Therefore, an upside correction towards the $9,800 and $10,000 levels could face a strong selling interest in the near term. On the downside, an immediate support is near the $9,500 level. If there is a downside break below the $9,500 support, the price could continue to decline towards the $9,200 support area.
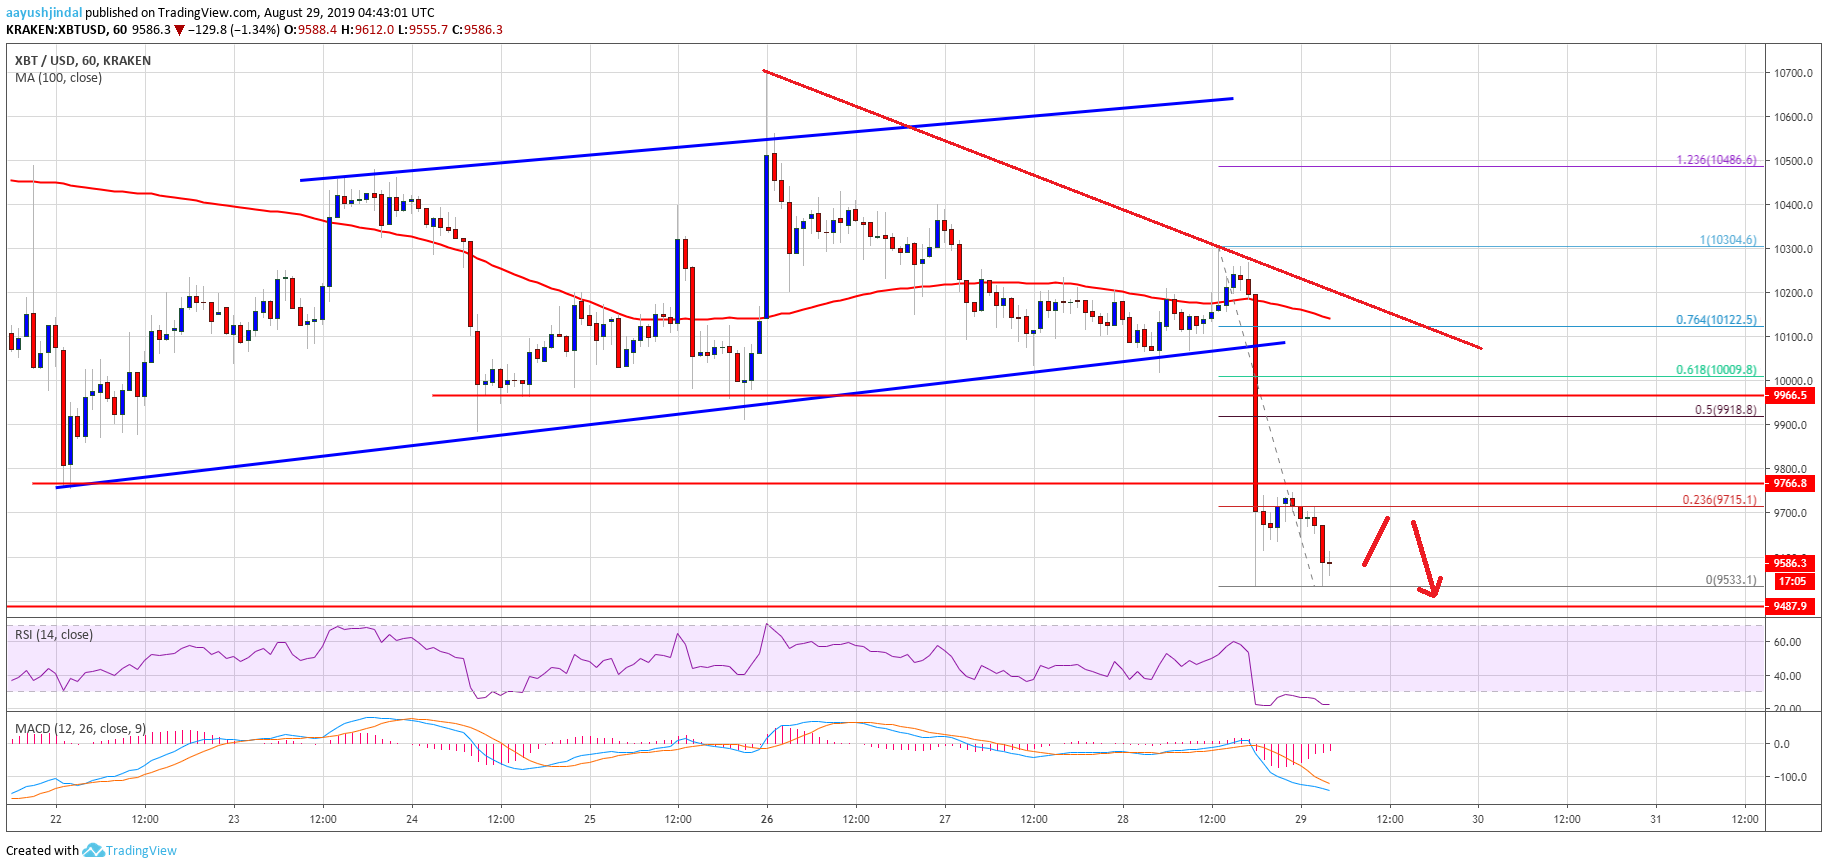
Looking at the chart, bitcoin price is clearly trading in a downtrend below $9,800 and $10,000. Any upside recovery is likely to face sellers near $9,800 and $9,850. On the downside, the bears are likely to aim for a break below $9,500.
Technical indicators:
Hourly MACD – The MACD is slowly losing momentum in the bearish zone.
Hourly RSI (Relative Strength Index) – The RSI for BTC/USD is currently in the oversold area.
Major Support Levels – $9,500 followed by $9,200.
Major Resistance Levels – $9,700, $9,800 and $10,000.
The post Bitcoin Price (BTC) Trend Overwhelmingly Bearish, Turned Sell On Rallies appeared first on NewsBTC.
source https://www.tokentalk.co/NewsBTC/bitcoin-price-btc-trend-overwhelmingly-bearish-turned-sell-on-rallies-5d6768f012c89efd0ab41ae3
Thursday, 29 August 2019
Bitcoin Price (BTC) Trend Overwhelmingly Bearish, Turned Sell On Rallies @newsbtc #Analysis #Technical #bitcoin #btc
Subscribe to:
Post Comments (Atom)
This analyst says there’s a “high chance” Bitcoin may never fall under $5k again @cryptoslate #Analysis #Price Watch
Once Bitcoin (BTC) started to incur strong losses in the second half of 2019, analysts were once again making extremely low price prediction...

-
The Indian Ministry of Commerce and Industry announced yesterday that the Coffee Board in the country is integrating blockchain into the cof...
-
App-enabled cryptocurrency exchange and wallet provider, Zebpay, has announced that it is enabling Lightning Network payments for all its ...
-
Disclaimer: These summaries are provided for educational purposes only by Nelson Rosario and Stephen Palley... Disclaimer: These summaries...

No comments:
Post a Comment