- Bitcoin price broke the key $11,200 support level and declined below $11,000 against the US Dollar.
- The price tested the $10,500 bearish target (as discussed in the weekly forecast).
- There is a m...
- Bitcoin price broke the key $11,200 support level and declined below $11,000 against the US Dollar.
- The price tested the $10,500 bearish target (as discussed in the weekly forecast).
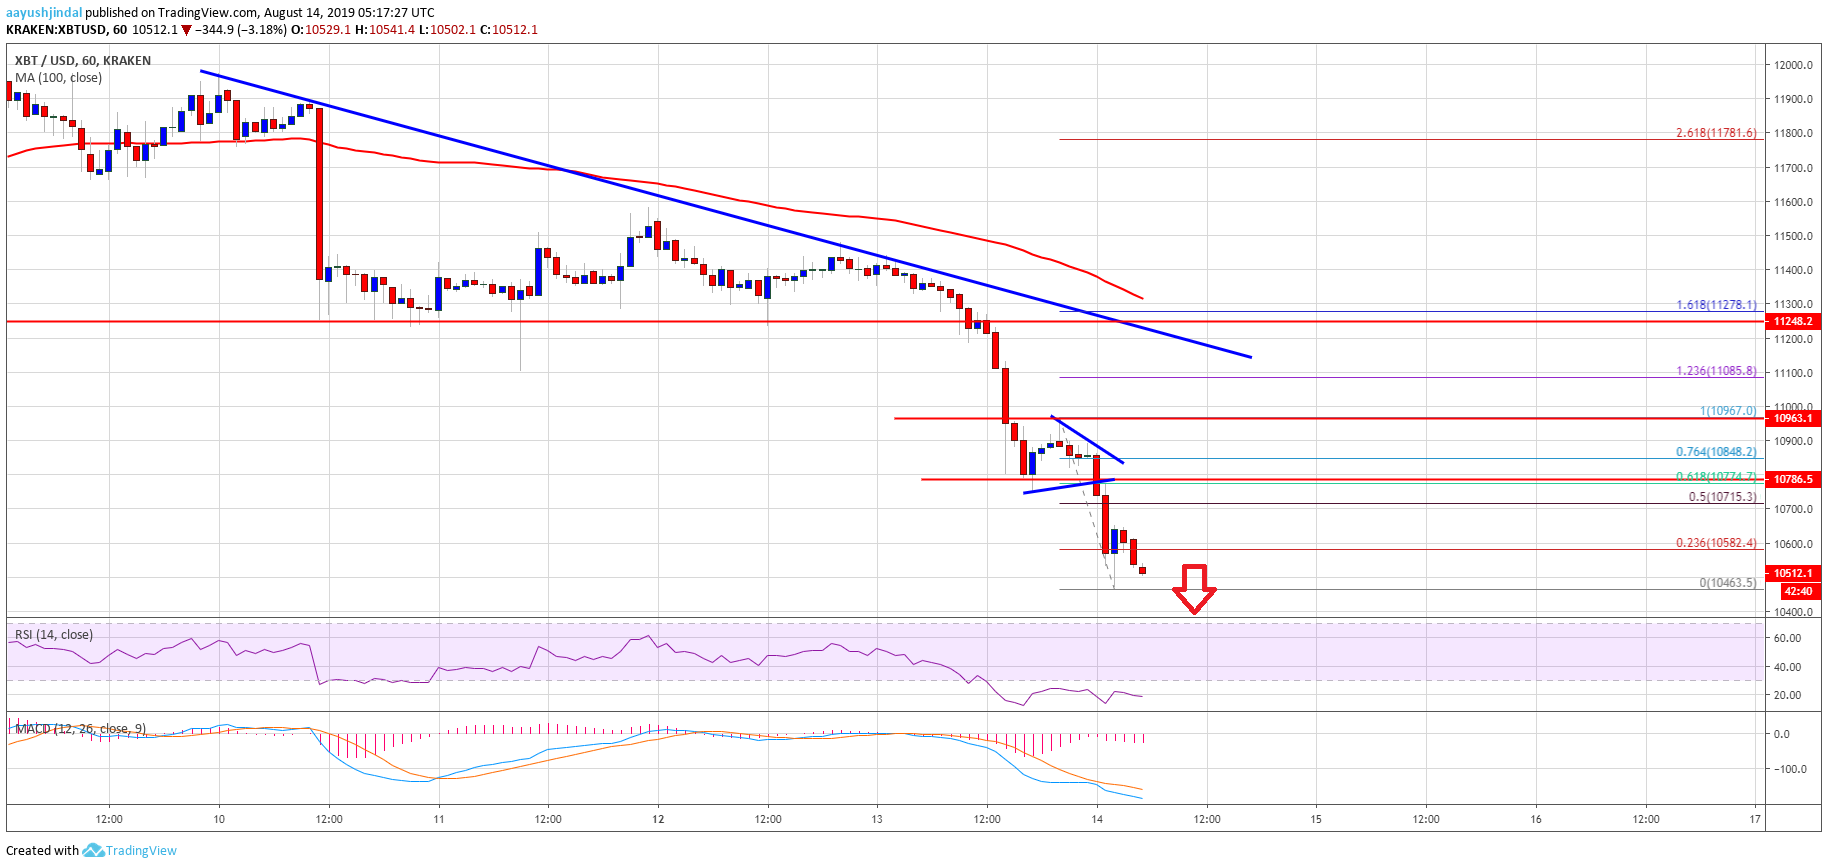
- There is a major bearish trend line forming with resistance near $11,200 on the hourly chart of the BTC/USD pair (data feed from Kraken).
- The price remains at a risk of more losses below the $10,500 and $10,320 levels.
Bitcoin price is gaining bearish momentum below $11,000 against the US Dollar. BTC price tested the weekly bearish target of $10,500 and it could continue to weaken.
Bitcoin Price Analysis
In the bitcoin price weekly forecast, we discussed the chances of a drop to $10,500 against the US Dollar. The BTC/USD pair did follow a bearish path this week below $11,500 and 100 hourly simple moving average. As a result, there was a bearish break below the $11,200 and $11,000 support levels. Moreover, the price weakened more than 6% today and even broke the $10,800 support area.
Finally, it spiked below the $10,500 level and traded to a new weekly low at $10,463. It is currently consolidating losses above $10,500. An immediate resistance is near $10,580 plus the 23.6% Fib retracement level of the recent decline from the $10,967 high to $10,463 low. On the upside, the first key resistance is near the $10,720 level. It represents the 50% Fib retracement level of the recent decline from the $10,967 high to $10,463 low.
If there is an upside break above the $10,700 and $10,800 levels, the price could correct higher towards the $11,000 level. The next hurdle could be $11,080 plus the 1.236 Fib extension level of the recent decline from the $10,967 high to $10,463 low. Moreover, there is a major bearish trend line forming with resistance near $11,200 on the hourly chart of the BTC/USD pair.
The main resistance is near the $11,200 level (this week’s support area). On the downside, an immediate support is near the $10,450 level. If there is a bearish break, the price could slide further towards the $10,200 level. The main support is near the $10,000 level, where the bulls might take a stand.
Looking at the chart, bitcoin price is gaining bearish momentum below $11,000 and $10,800. Therefore, there are chances of more downsides below $10,500 and $10,450. Conversely, if there is an upside correction, the price is likely to face resistance near the $10,700 and $10,800 levels.
Technical indicators:
Hourly MACD – The MACD is currently placed in the bearish zone.
Hourly RSI (Relative Strength Index) – The RSI for BTC/USD is currently correcting higher from the 20 level.
Major Support Levels – $10,450 followed by $10,200.
Major Resistance Levels – $10,700, $10,800 and $11,000.
The post Bitcoin (BTC) Price Hits Weekly Bearish Target: $10K Could Be Next appeared first on NewsBTC.
source https://www.tokentalk.co/NewsBTC/bitcoin-btc-price-hits-weekly-bearish-target-10k-could-be-next-5d53a2716fe5556e3f9473ff
Tuesday, 13 August 2019
Bitcoin (BTC) Price Hits Weekly Bearish Target: $10K Could Be Next @newsbtc #Analysis #Technical #bitcoin #btc
Subscribe to:
Post Comments (Atom)
This analyst says there’s a “high chance” Bitcoin may never fall under $5k again @cryptoslate #Analysis #Price Watch
Once Bitcoin (BTC) started to incur strong losses in the second half of 2019, analysts were once again making extremely low price prediction...

-
The Indian Ministry of Commerce and Industry announced yesterday that the Coffee Board in the country is integrating blockchain into the cof...
-
App-enabled cryptocurrency exchange and wallet provider, Zebpay, has announced that it is enabling Lightning Network payments for all its ...
-
Once Bitcoin (BTC) started to incur strong losses in the second half of 2019, analysts were once again making extremely low price prediction...


No comments:
Post a Comment