- Bitcoin price is struggling to climb above the $11,500 and $11,600 resistances against the US Dollar.
- The price is holding the key $11,200 support, but it remains at a risk of more downsides.
- The...
- Bitcoin price is struggling to climb above the $11,500 and $11,600 resistances against the US Dollar.
- The price is holding the key $11,200 support, but it remains at a risk of more downsides.
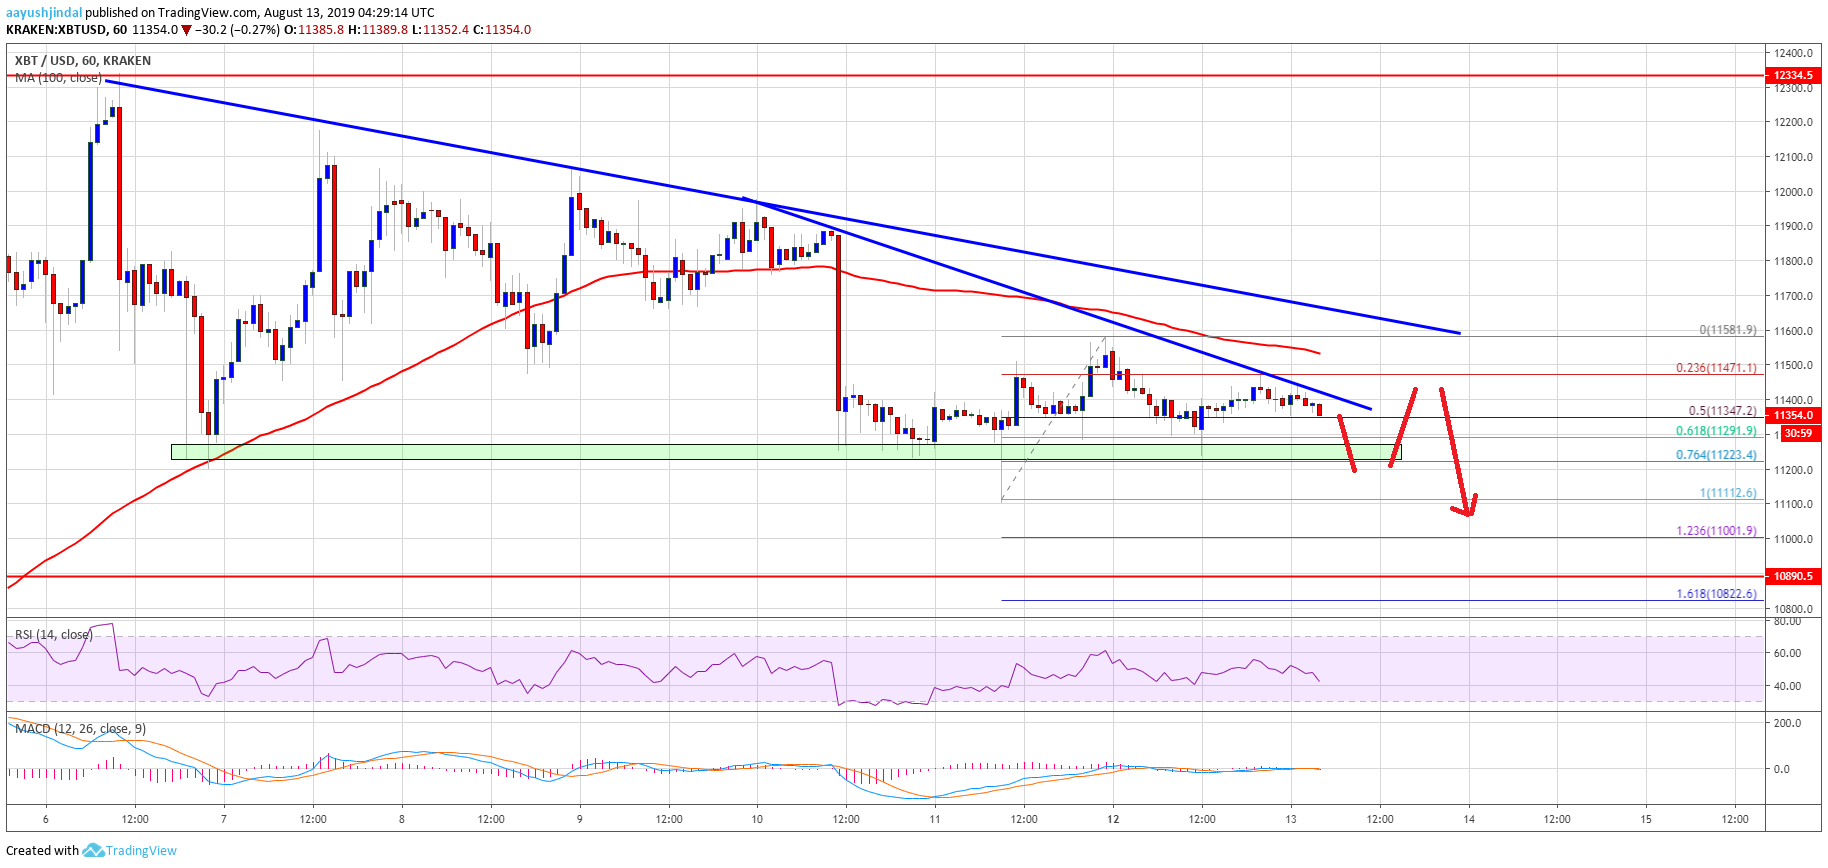
- There are two key bearish trend lines forming with resistance near $11,400 and $11,600 on the hourly chart of the BTC/USD pair (data feed from Kraken).
- The price could decline heavily if there is a break below the $11,200 support area in the near term.
Bitcoin price is showing bearish signs below $11,500 against the US Dollar. BTC price might soon decline below the $11,200 support and extend losses towards $10,500.
Bitcoin Price Analysis
Recently, bitcoin price traded below the key $11,500 support area against the US Dollar. The BTC/USD pair also settled below $11,600 and the 100 hourly simple moving average. It opened the doors for more downside and the price spiked below the $11,200 support. Finally, a swing low was formed at $11,112 and the price recently settled above the $11,200 pivot level.
Moreover, there was an upside correction above the $11,400 level. However, the recovery was capped by the $11,600 resistance area. More importantly, the 50% Fib retracement level of the decline from the $11,976 high to $11,112 low acted as a resistance. The price is now trading with a bearish angle below the $11,500 level. Besides, it is testing the 50% Fib retracement level of the upward move from the $11,112 low to $11,581 high.
On the downside, there is a strong support near the $11,200 level. The 61.8% Fib retracement level of the upward move from the $11,112 low to $11,581 high might also act as a support. Therefore, a downside break below the $11,200 support could start another drop. The next major support is near $11,000, below which bitcoin price could decline towards $10,500 (as discussed in the weekly forecast).
On the upside, there are many hurdles near the $11,500 and $11,600 levels. Moreover, there are two key bearish trend lines forming with resistance near $11,400 and $11,600 on the hourly chart of the BTC/USD pair. Therefore, a successful close above the $11,500 and $11,600 levels is needed for a fresh upward move.
Looking at the chart, bitcoin price is clearly struggling to recover above the $11,600 resistance and the 100 hourly simple moving average. As long as there is no daily close above $11,600 and $11,800, there is a risk of more losses in the near term.
Technical indicators:
Hourly MACD – The MACD is gaining momentum in the bearish zone.
Hourly RSI (Relative Strength Index) – The RSI for BTC/USD is currently moving lower and is below 50.
Major Support Levels – $11,200 followed by $11,000.
Major Resistance Levels – $11,500, $11,600 and $11,800.
The post Bitcoin (BTC) Price Technical Bias Favors More Downsides appeared first on NewsBTC.
source https://www.tokentalk.co/NewsBTC/bitcoin-btc-price-technical-bias-favors-more-downsides-5d5250f16fe5556e3f9473ac
Monday, 12 August 2019
Bitcoin (BTC) Price Technical Bias Favors More Downsides @newsbtc #Analysis #Technical #bitcoin #btc
Subscribe to:
Post Comments (Atom)
This analyst says there’s a “high chance” Bitcoin may never fall under $5k again @cryptoslate #Analysis #Price Watch
Once Bitcoin (BTC) started to incur strong losses in the second half of 2019, analysts were once again making extremely low price prediction...

-
The Indian Ministry of Commerce and Industry announced yesterday that the Coffee Board in the country is integrating blockchain into the cof...
-
App-enabled cryptocurrency exchange and wallet provider, Zebpay, has announced that it is enabling Lightning Network payments for all its ...
-
Once Bitcoin (BTC) started to incur strong losses in the second half of 2019, analysts were once again making extremely low price prediction...


No comments:
Post a Comment