- ETH price started a short term upside correction from the $201 low against the US Dollar.
- Ethereum price is currently trading near the key $215 resistance area and is showing bearish signs.
- There...
- ETH price started a short term upside correction from the $201 low against the US Dollar.
- Ethereum price is currently trading near the key $215 resistance area and is showing bearish signs.
- There is a key ascending channel forming with support near $212 on the hourly chart of ETH/USD (data feed via Kraken).
- The pair could either continue to rise above the $215 resistance or it might resume its downward move.
Ethereum price is trading near a major resistance versus the US Dollar and bitcoin. ETH price is likely to decline again if it fails to surpass the $215-$216 resistance zone.
Ethereum Price Analysis
Recently, we saw a sharp decline in ETH price below the $220 and $215 supports against the US Dollar. The price even broke the $210 support level and settled below the 100 hourly simple moving average. Finally, the price tested the $200-$201 support area. A swing low was formed near $201 and the price started an upside correction above the $205 level. Moreover, there was a break above the 23.6% Fib retracement level of the downward move from the $226 swing high to $201 swing low.
The recovery was such that the price climbed above the $215 level and the 100 hourly SMA. However, the price failed to gain strength above the 50% Fib retracement level of the downward move from the $226 swing high to $201 swing low. Additionally, it seems like the price failed to surpass the previous support zone (now resistance) near the $215-216 region.
At the moment, the price is trading well below the $215 level and the 100 hourly SMA. An immediate support is near the $212 level. Furthermore, there is a key ascending channel forming with support near $212 on the hourly chart of ETH/USD. Therefore, if there is a downside break below the $212 support, Ethereum price could resume its decline below the $210 support. The next key support is near the $202 and $201 levels.
On the upside, the main resistance is near the $215 and $216 levels. If there is a successful close above the $216 level, the price could continue to recover. The next stop for the bulls in the mentioned case could be near the $220 and $222 levels.
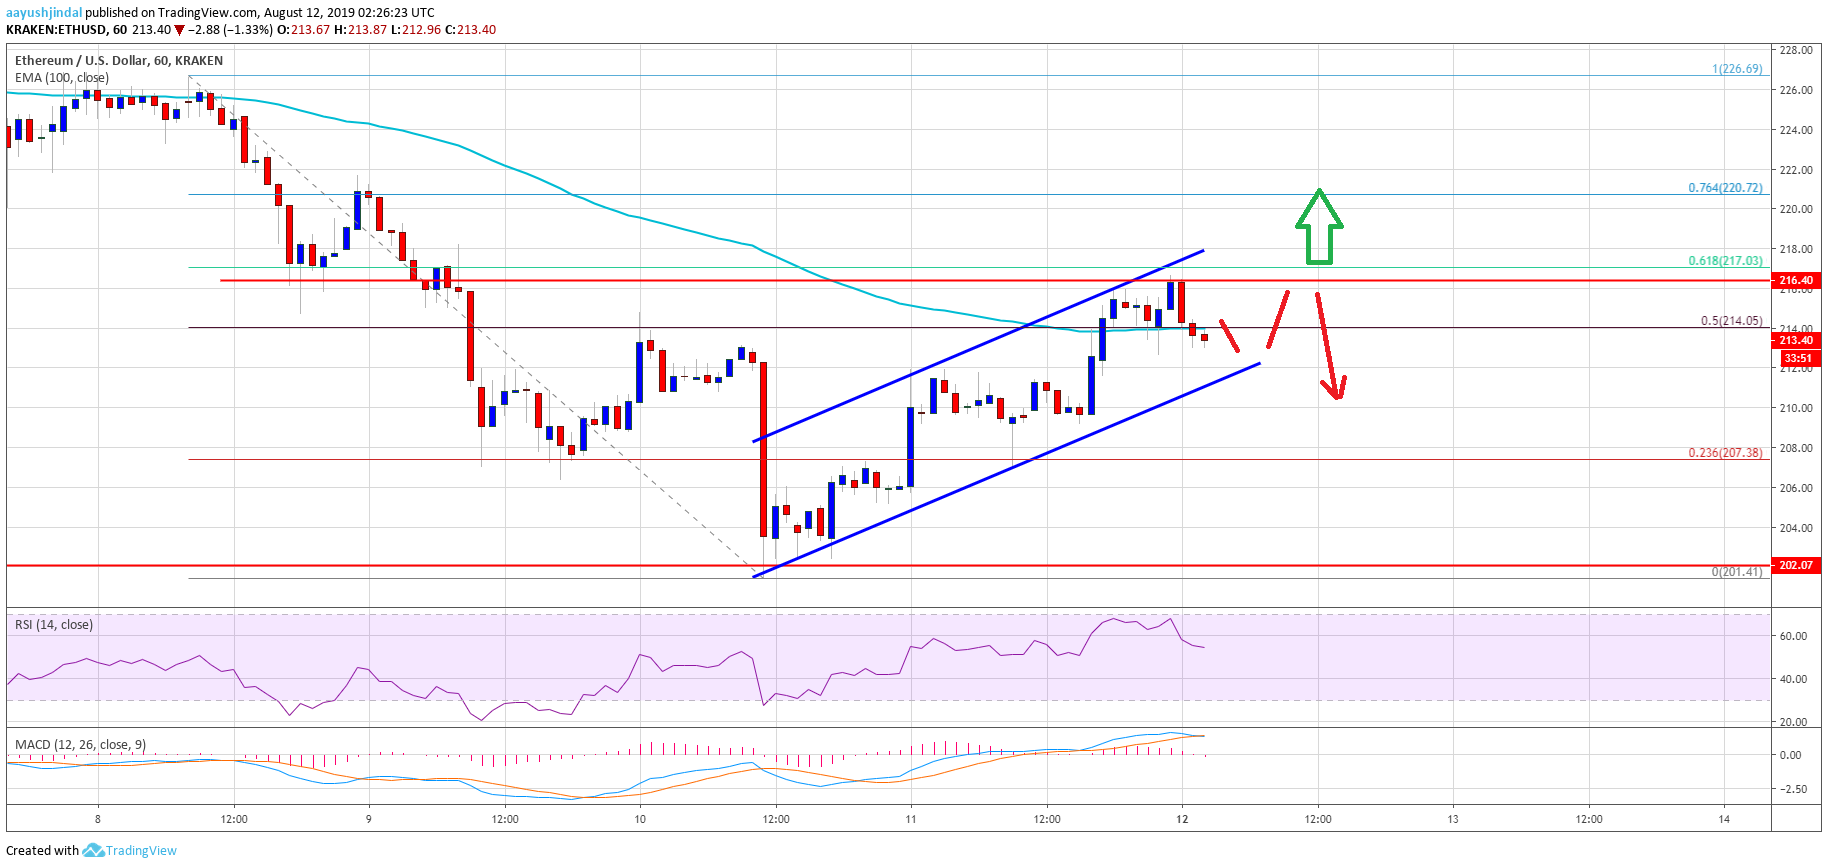
Looking at the chart, Ethereum price is clearly trading near a couple of important hurdles near the $215 level. In the short term, there could be range moves before the price either breaks $216 or starts a fresh decline.
ETH Technical Indicators
Hourly MACD – The MACD for ETH/USD is moving back into the bullish zone.
Hourly RSI – The RSI for ETH/USD is moving lower towards the 50 level.
Major Support Level – $212
Major Resistance Level – $216
The post Ethereum Price (ETH) Near Inflection Point With Bearish Angle appeared first on NewsBTC.
source https://www.tokentalk.co/NewsBTC/ethereum-price-eth-near-inflection-point-with-bearish-angle-5d50d7216fe5556e3f947360
Sunday, 11 August 2019
Ethereum Price (ETH) Near Inflection Point With Bearish Angle @newsbtc #Analysis #Technical #ETH #ethereum
Subscribe to:
Post Comments (Atom)
This analyst says there’s a “high chance” Bitcoin may never fall under $5k again @cryptoslate #Analysis #Price Watch
Once Bitcoin (BTC) started to incur strong losses in the second half of 2019, analysts were once again making extremely low price prediction...

-
The Indian Ministry of Commerce and Industry announced yesterday that the Coffee Board in the country is integrating blockchain into the cof...
-
App-enabled cryptocurrency exchange and wallet provider, Zebpay, has announced that it is enabling Lightning Network payments for all its ...
-
Once Bitcoin (BTC) started to incur strong losses in the second half of 2019, analysts were once again making extremely low price prediction...


No comments:
Post a Comment