- Ripple price struggled to continue higher and declined below the $0.3100 level against the US dollar.
- The price is currently consolidating losses after it traded as low as $0.3038.
- There are two ...
- Ripple price struggled to continue higher and declined below the $0.3100 level against the US dollar.
- The price is currently consolidating losses after it traded as low as $0.3038.
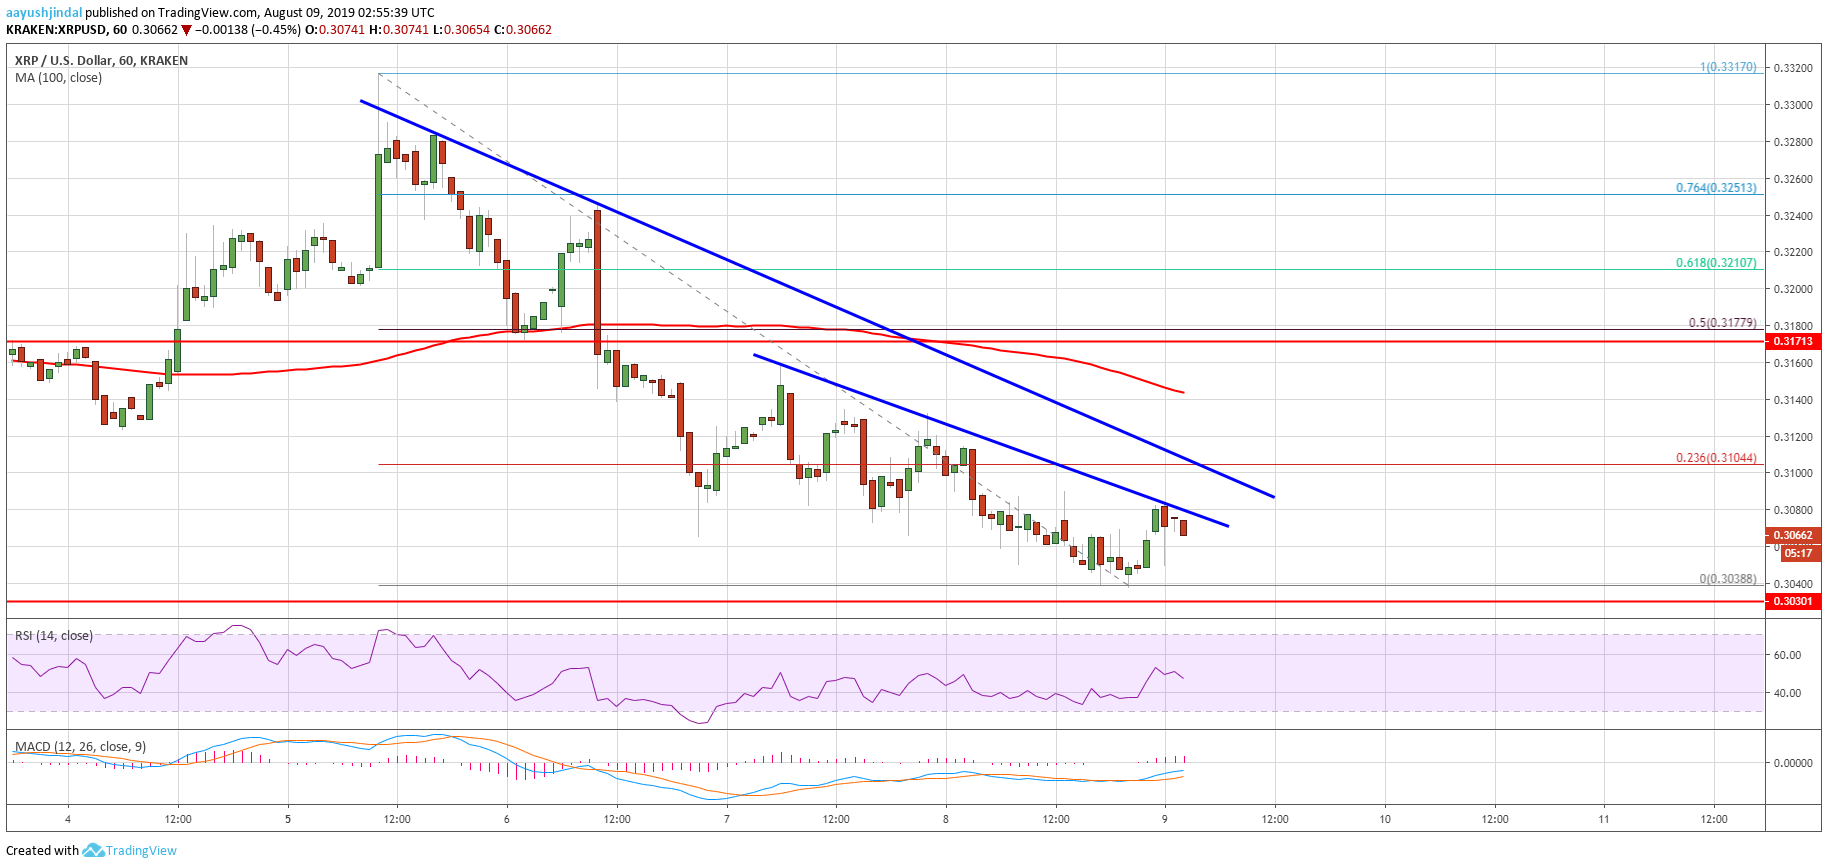
- There are two key bearish trend lines forming with resistance near $0.3100 on the hourly chart of the XRP/USD pair (data source from Kraken).
- The pair remains at a risk of more downsides as long as there is no close above $0.3120.
Ripple price is trading with a bearish below key supports against the US Dollar and bitcoin. XRP price might soon test the $0.3000 support level if the bears remain in action.
Ripple Price Analysis
After topping near the $0.3320 resistance, ripple price declined steadily against the US Dollar. Ethereum price also declined recently below the $220 support, but bitcoin price remained stable near $11,800. The XRP/USD pair is following a bearish path and it recently broke the $0.3200 and $0.3120 support levels. Moreover, there was a break below the $0.3080 support. Finally, the price settled below the 100 hourly simple moving average and a swing low was formed near $0.3038.
At the moment, the price is correcting higher towards the $0.3080 level. However, there are many resistances near the $0.3080 and $0.3100 levels. Moreover, the 23.6% Fib retracement level of the main decline from the $0.3317 high to $0.3038 low is also near $0.3104. More importantly, there are two key bearish trend lines forming with resistance near $0.3100 on the hourly chart of the XRP/USD pair.
Above the second trend line, the next resistance is near the $0.3120 level. However, the main resistances are near $0.3150, the 100 hourly SMA, and the $0.3180 level. Additionally, the 50% Fib retracement level of the main decline from the $0.3317 high to $0.3038 low is near the $0.3177 level to act as a resistance. Therefore, ripple bulls might struggle to push the price above the $0.3100 and $0.3120 resistance levels.
On the downside, the $0.3040 level is an immediate support. If there is a downside break below $0.3040, the price could test the $0.3000 support area. Any further losses may perhaps lead the price towards the $0.2920 support.
Looking at the chart, ripple price is clearly trading in a bearish zone below the $0.3120 and $0.3150 resistance levels. Therefore, the price is likely to decline further below $0.3040 unless there is a successful break above the $0.3150 resistance area.
Technical Indicators
Hourly MACD – The MACD for XRP/USD is currently moving in the bullish zone.
Hourly RSI (Relative Strength Index) – The RSI for XRP/USD is likely to move above the 50 level.
Major Support Levels – $0.3080, $0.3100 and $0.3120.
Major Resistance Levels – $0.3040, $0.3000 and $0.2920.
The post Ripple Price (XRP) Back To Square One But Bitcoin Holding Gains appeared first on NewsBTC.
source https://www.tokentalk.co/NewsBTC/ripple-price-xrp-back-to-square-one-but-bitcoin-holding-gains-5d4cf0b06fe5556e3f9472d6
Friday, 9 August 2019
Ripple Price (XRP) Back To Square One But Bitcoin Holding Gains @newsbtc #Analysis #Technical #Ripple #xrp
Subscribe to:
Post Comments (Atom)
This analyst says there’s a “high chance” Bitcoin may never fall under $5k again @cryptoslate #Analysis #Price Watch
Once Bitcoin (BTC) started to incur strong losses in the second half of 2019, analysts were once again making extremely low price prediction...

-
The Indian Ministry of Commerce and Industry announced yesterday that the Coffee Board in the country is integrating blockchain into the cof...
-
App-enabled cryptocurrency exchange and wallet provider, Zebpay, has announced that it is enabling Lightning Network payments for all its ...
-
Once Bitcoin (BTC) started to incur strong losses in the second half of 2019, analysts were once again making extremely low price prediction...


No comments:
Post a Comment