- Ripple price trimmed losses after it traded as low as $0.2336 against the US dollar.
- The price is currently trading above the $0.2500 pivot level with a few positive signs.
- A major contracting tr...
- Ripple price trimmed losses after it traded as low as $0.2336 against the US dollar.
- The price is currently trading above the $0.2500 pivot level with a few positive signs.
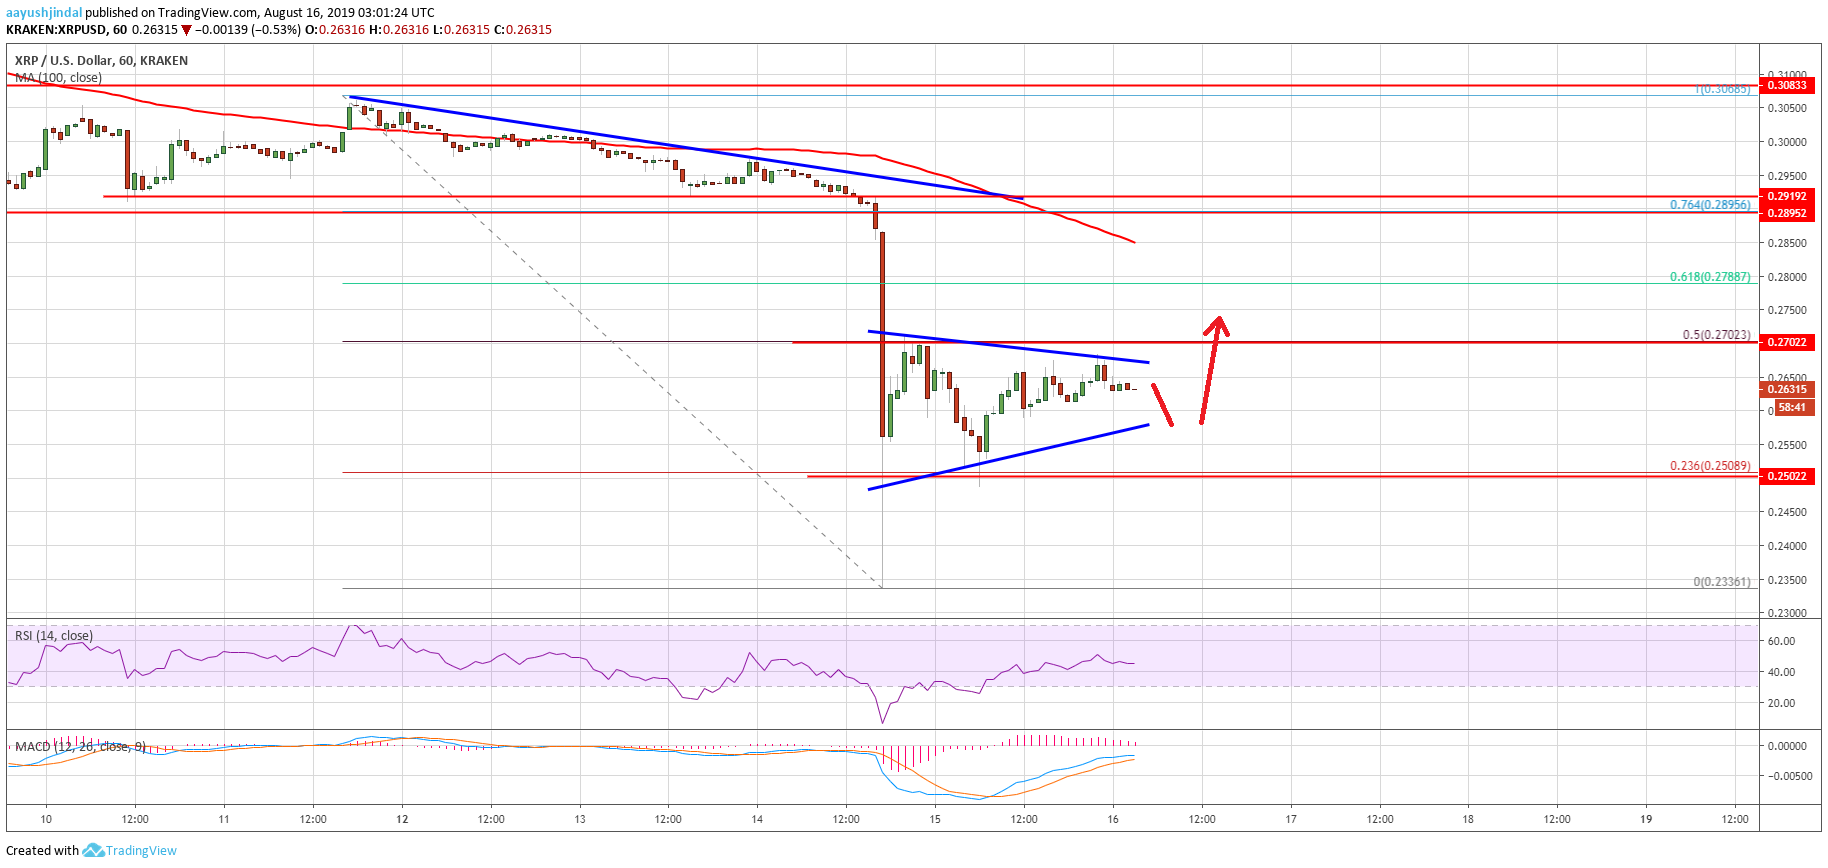
- A major contracting triangle pattern is forming with resistance near $0.2670 on the hourly chart of the XRP/USD pair (data source from Kraken).
- The pair is likely to recover towards the $0.2800 resistance as long as it is above the $0.2500 support.
Ripple price is showing signs of a decent recovery against the US Dollar, while bitcoin recovered 3%. XRP price must stay above the $0.2500 support area to continue its upside.
Ripple Price Analysis
Yesterday, there was a strong decline in Ethereum, bitcoin and ripple price against the US Dollar. The XRP/USD pair declined sharply below the $0.2800 and $0.2500 support levels. Finally, the price settled below the 100 hourly simple moving average and a swing low was formed at $0.2336. Recently, the price started a decent recovery and climbed above the $0.2400 and $0.2500 levels.
Moreover, there was a break above the 23.6% Fib retracement level of the downward move from the $0.3088 swing high to $0.2336 swing low. However, the price is facing a strong resistance near the $0.2650 and $0.2700 levels. More importantly, the 50% Fib retracement level of the downward move from the $0.3088 swing high to $0.2336 swing low is acting as a hurdle.
At the moment, there is a major contracting triangle pattern is forming with resistance near $0.2670 on the hourly chart of the XRP/USD pair. If there is an upside break above the $0.2670 and $0.2700 resistances, ripple price could continue to recover. The next key resistance is near the $0.2850 level and the 100 hourly SMA. If there are more gains, the price could test the $0.3000 resistance area.
Conversely, if there is a bearish break below the $0.2550 and $0.2500 support levels, the price could resume its decline. An immediate support below $0.2500 is near $0.2400. If the price fails to stay above $0.2400 or $0.2350, there could be a sharp drop towards the $0.2200 support area.
Looking at the chart, ripple price is facing an uphill task near the $0.2650 and $0.2700 levels. However, the current price action suggests that the price might climb higher towards $0.2800 and $0.2850. If not, there is a risk of another strong decline below the $0.2500 support area in the near term.
Technical Indicators
Hourly MACD – The MACD for XRP/USD is slowly moving back into the bearish zone.
Hourly RSI (Relative Strength Index) – The RSI for XRP/USD is currently moving lower towards the 40 level.
Major Support Levels – $0.2550, $0.2500 and $0.2400.
Major Resistance Levels – $0.2670, $0.2700 and $0.2800.
The post Ripple Price (XRP) Showing Recovery Signs, Bitcoin Back Above $10.2K appeared first on NewsBTC.
source https://www.tokentalk.co/NewsBTC/ripple-price-xrp-showing-recovery-signs-bitcoin-back-above-102k-5d562b306fe5556e3f9474a4
Thursday, 15 August 2019
Ripple Price (XRP) Showing Recovery Signs, Bitcoin Back Above $10.2K @newsbtc #Analysis #Technical #Ripple #xrp
Subscribe to:
Post Comments (Atom)
This analyst says there’s a “high chance” Bitcoin may never fall under $5k again @cryptoslate #Analysis #Price Watch
Once Bitcoin (BTC) started to incur strong losses in the second half of 2019, analysts were once again making extremely low price prediction...

-
The Indian Ministry of Commerce and Industry announced yesterday that the Coffee Board in the country is integrating blockchain into the cof...
-
App-enabled cryptocurrency exchange and wallet provider, Zebpay, has announced that it is enabling Lightning Network payments for all its ...
-
Ripple price climbed higher recently above the $0.2450 and $0.2500 resistances against the US dollar. The price is currently trading near ...


No comments:
Post a Comment