- Bitcoin price extended gains above the $11,500 and $11,700 resistances against the US Dollar.
- The price is currently correcting lower after trading close to the $12,000 resistance.
- There is a con...
- Bitcoin price extended gains above the $11,500 and $11,700 resistances against the US Dollar.
- The price is currently correcting lower after trading close to the $12,000 resistance.
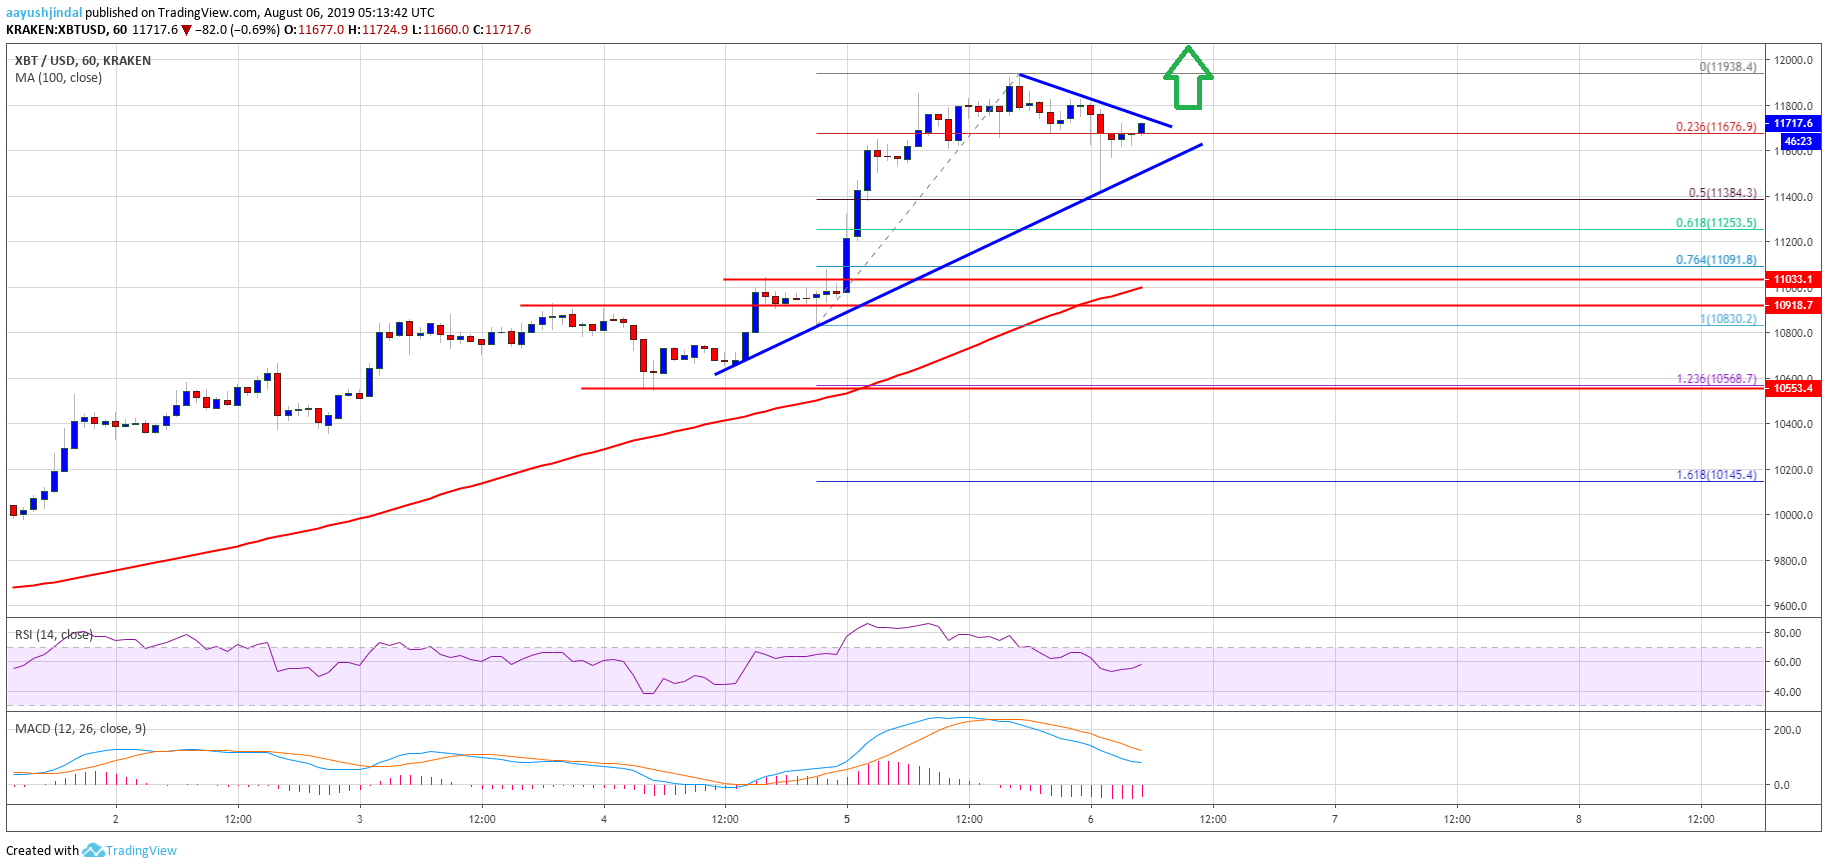
- There is a connecting bullish trend line forming with support near $11,540 on the hourly chart of the BTC/USD pair (data feed from Kraken).
- The price remains in an uptrend and it could surpass $12,000 to test the $12,200 level.
Bitcoin price is gaining bullish momentum above $11,500 against the US Dollar. BTC price might continue to climb higher towards $12,000 and $12,200 in the near term.
Bitcoin Price Analysis (BTC/USD)
Yesterday, we saw a solid upward move in bitcoin price above $11,200 against the US Dollar. The BTC/USD pair even broke the $11,500 resistance and settled above the 100 hourly simple moving average. Later, the price climbed above the $11,700 resistance and traded close to the $12,000 level. Finally, a swing high was formed near $11,938 and the price recently corrected lower.
It broke the $11,800 level plus the 23% Fib retracement level of the recent wave from the $10,830 low to $11,938 high. However, the decline found support near the $11,400 level. Moreover, there was no close below the $11,500 support level. At the moment, the price is trading nicely above the 50% Fib retracement level of the recent wave from the $10,830 low to $11,938 high.
More importantly, there is a connecting bullish trend line forming with support near $11,540 on the hourly chart of the BTC/USD pair. If there is a downside break below the trend line support and $11,500, there could be an extended correction. Additionally, the next major support is near the $11,250 level. It represents the 61.8% Fib retracement level of the recent wave from the $10,830 low to $11,938 high.
On the upside, an immediate resistance is near the $11,800 level. Moreover, there is a connecting bearish trend line near $11,800 on the same chart. Therefore, a successful break above $11,800 might set the pace for more upsides above the $11,900 and $12,000 levels. Additionally, the next key resistance above $12,000 is near the $12,200 level.
Looking at the chart, bitcoin price is clearly trading in a nice uptrend above $11,500 with a strong technical bias. Thus, if there are more upsides, the price could easily hit the $12,200 resistance level. Conversely, a downside break below the $11,250 support might push the price back towards the $10,800 support area.
Technical indicators:
Hourly MACD – The MACD is likely to move back into the bullish zone.
Hourly RSI (Relative Strength Index) – The RSI for BTC/USD is currently well above the 50 level, with a bullish angle.
Major Support Levels – $11,500 followed by $11,250.
Major Resistance Levels – $11,800, $12,000 and $12,200.
The post Bitcoin Price (BTC/USD) Could Hit $12.2K Amid Strong Technical Bias appeared first on NewsBTC.
source https://www.tokentalk.co/NewsBTC/bitcoin-price-btcusd-could-hit-122k-amid-strong-technical-bias-5d4916717be6c31b6def98e7
Tuesday, 6 August 2019
Bitcoin Price (BTC/USD) Could Hit $12.2K Amid Strong Technical Bias @newsbtc #Analysis #Technical #bitcoin #btc
Subscribe to:
Post Comments (Atom)
This analyst says there’s a “high chance” Bitcoin may never fall under $5k again @cryptoslate #Analysis #Price Watch
Once Bitcoin (BTC) started to incur strong losses in the second half of 2019, analysts were once again making extremely low price prediction...

-
The Indian Ministry of Commerce and Industry announced yesterday that the Coffee Board in the country is integrating blockchain into the cof...
-
App-enabled cryptocurrency exchange and wallet provider, Zebpay, has announced that it is enabling Lightning Network payments for all its ...
-
Once Bitcoin (BTC) started to incur strong losses in the second half of 2019, analysts were once again making extremely low price prediction...


No comments:
Post a Comment