- Bitcoin price traded higher and broke the key $10,200 resistance area against the US Dollar.
- The price is placed nicely above the $10,200 level and it recently tested the $10,500 area.
- There is a...
- Bitcoin price traded higher and broke the key $10,200 resistance area against the US Dollar.
- The price is placed nicely above the $10,200 level and it recently tested the $10,500 area.
- There is a major bullish trend line forming with support near $10,200 on the hourly chart of the BTC/USD pair (data feed from Kraken).
- The price remains in an uptrend and it may soon accelerate above the $10,500 resistance level.
There were decent gains in bitcoin price above $10,200 against the US Dollar. BTC price is likely preparing for more gains above the $10,500 and $10,600 levels.
Bitcoin Price Analysis
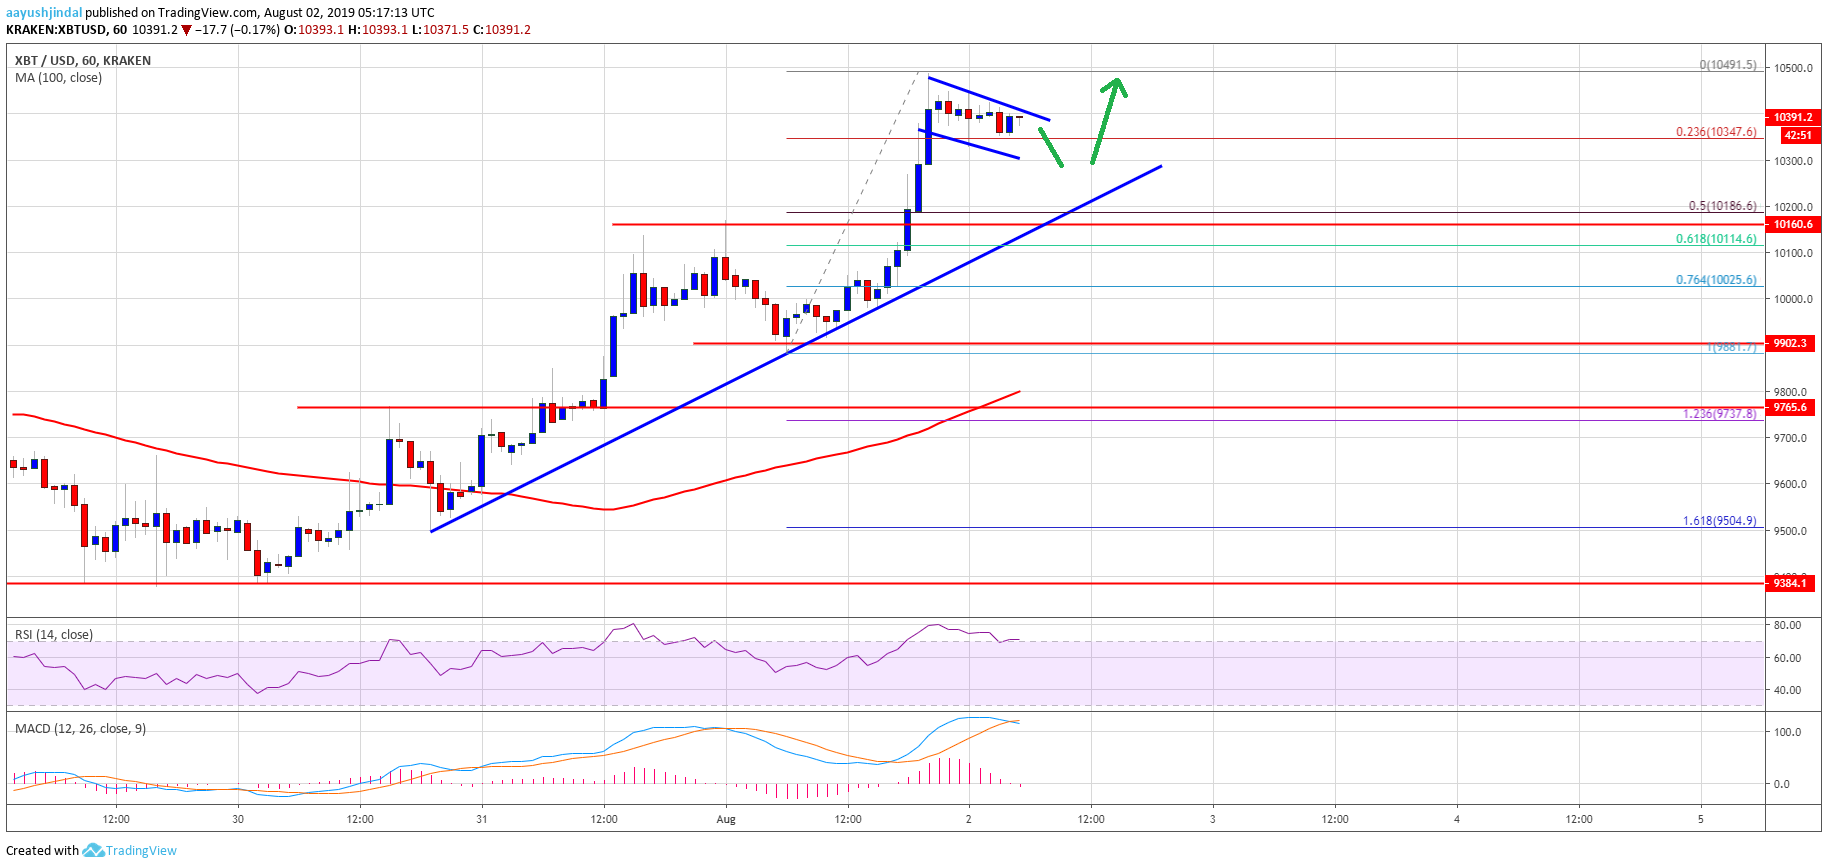
In the past few sessions, there were positive moves in bitcoin price above $10,000 against the US Dollar. The BTC/USD pair broke the main $10,200 resistance level to move further into the bullish zone. Moreover, there was a close above the $10,200 resistance and the 100 hourly simple moving average. It opened the doors for more gains above the $10,400 level and the price tested the $10,500 resistance level.
A swing high was formed near $10,491 and the price is currently consolidating gains. An immediate support is near the $10,350 level, plus the 23% Fib retracement level of the recent upward move from the $9,881 low to $10,491 high. Moreover, there is a short term declining channel or bullish flag forming with resistance near $10,400 on the hourly chart of the BTC/USD pair.
If there is an upside break, the price is likely to accelerate above $10,450 and $10,500. The next key resistance is near the $10,600 level. On the downside, there is a strong support forming near the $10,200 level. Moreover, there is a major bullish trend line forming with support near $10,200 on the same chart. Finally, the 50% Fib retracement level of the recent upward move from the $9,881 low to $10,491 high is near the $10,180 level.
Therefore, a downside correction towards the $10,200 level is likely to find strong buying interest in the near term. If there is a downside break below the $10,200 support, the price could revisit the $10,000 support area.
Looking at the chart, bitcoin price is trading with a bullish bias above the $10,000 and $10,200 support levels. Therefore, there are high chances of more gains above the $10,500 and $10,600 levels in the coming sessions. Only a close below $10,000 might push the price back in a bearish zone.
Technical indicators:
Hourly MACD – The MACD is slowly losing momentum in the bullish zone.
Hourly RSI (Relative Strength Index) – The RSI for BTC/USD is currently correcting lower towards the 55 level.
Major Support Levels – $10,200 followed by $10,000.
Major Resistance Levels – $10,400, $10,500 and $10,600.
The post Bitcoin Price (BTC/USD) Signaling Bullish Acceleration Above $10,500 appeared first on NewsBTC.
source https://www.tokentalk.co/NewsBTC/bitcoin-price-btcusd-signaling-bullish-acceleration-above-10500-5d43d071f4c85eab76fc9864
Thursday, 1 August 2019
Bitcoin Price (BTC/USD) Signaling Bullish Acceleration Above $10,500 @newsbtc #Analysis #Technical #bitcoin #btc
Subscribe to:
Post Comments (Atom)
This analyst says there’s a “high chance” Bitcoin may never fall under $5k again @cryptoslate #Analysis #Price Watch
Once Bitcoin (BTC) started to incur strong losses in the second half of 2019, analysts were once again making extremely low price prediction...

No comments:
Post a Comment