- ETH price gained bullish momentum and broke the $220 resistance level against the US Dollar.
- The price even climbed above the $225 resistance and tested the $230 zone.
- There was a break above a m...
- ETH price gained bullish momentum and broke the $220 resistance level against the US Dollar.
- The price even climbed above the $225 resistance and tested the $230 zone.
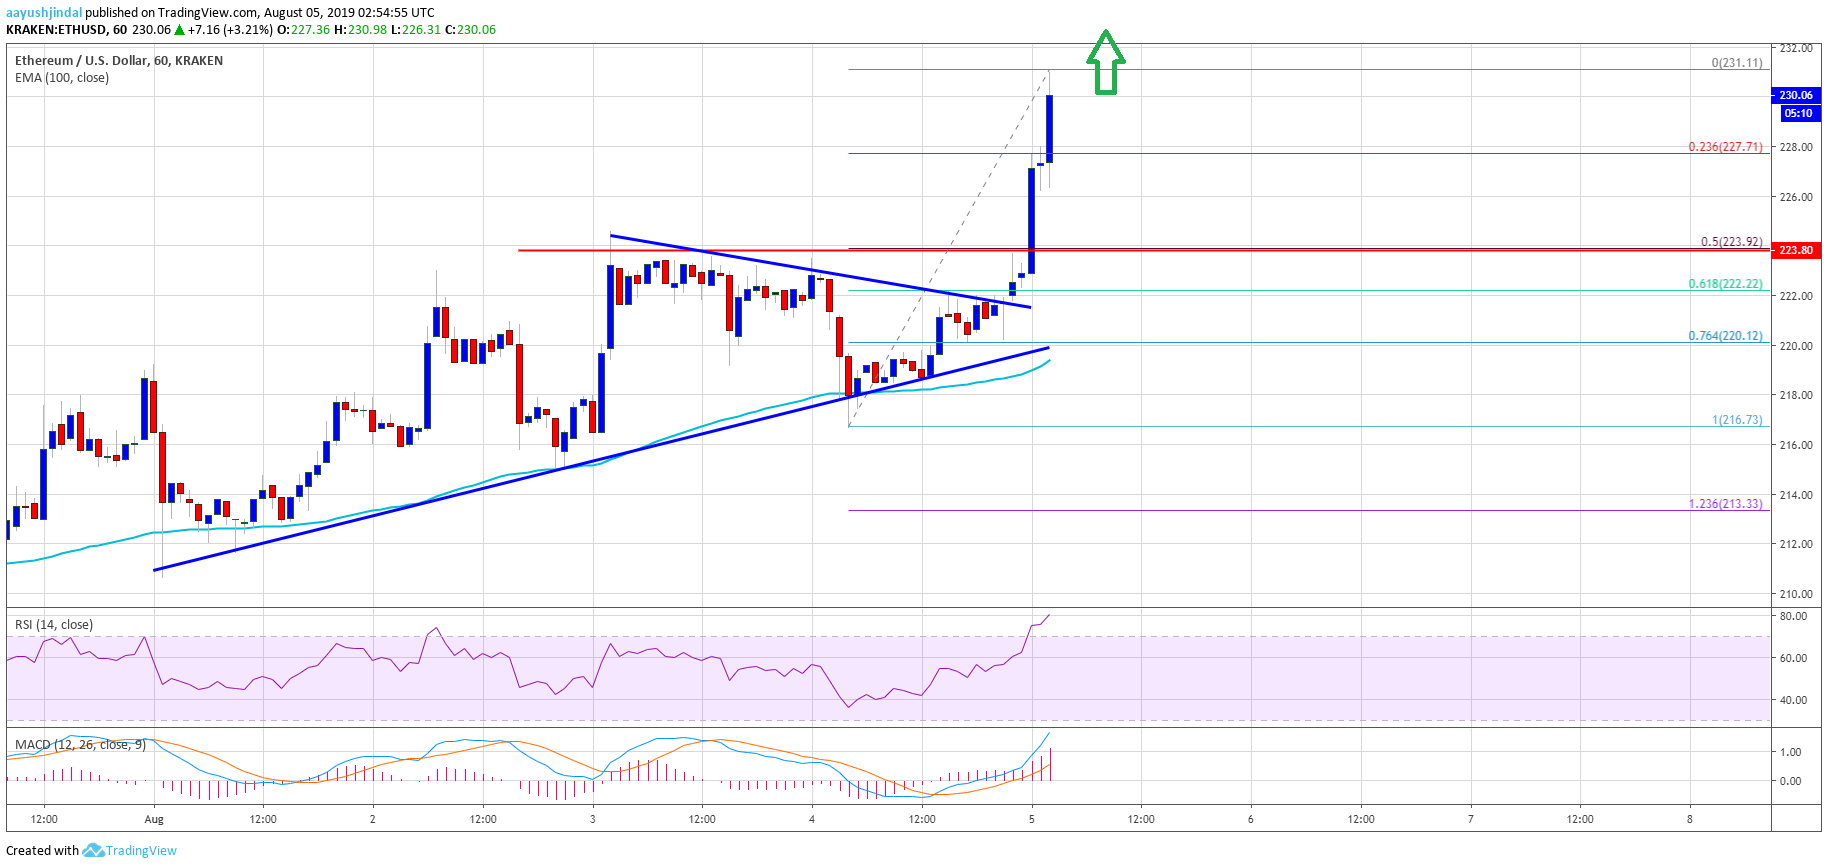
- There was a break above a major bearish trend line with resistance near $221 on the hourly chart of ETH/USD (data feed via Kraken).
- The pair is gaining momentum above the $225 resistance and it could climb towards the $240 level.
Ethereum price is showing a lot of positive signs above $225 versus the US Dollar, while bitcoin rallied 8%. ETH price might continue to climb towards the $240 and $250 levels.
Ethereum Price Analysis
In the past few sessions, there were bullish moves in Ethereum price above $220 against the US Dollar. The ETH/USD pair formed a swing low near the $216 level and recently started a strong upward move. The pair climbed above the key $220 resistance level to start an uptrend. More importantly, bitcoin price rallied above $11,200 (as discussed in the weekly forecast).
During the rise, there was a break above a major bearish trend line with resistance near $221 on the hourly chart of ETH/USD. The pair even cleared the $225 resistance and settled well above the 100 hourly simple moving average. A swing high is formed near $231 and the price is clearly gaining strength. An immediate support is near the $227 level. The 23.6% Fib retracement level of the recent rally from the $216 low to $230 high is also near the $227 level.
However, the main support is near the $224 level. The 50% Fib retracement level of the recent rally from the $216 low to $230 high is also near the $227 level is also near the $224 level. Moreover, the $224-$225 zone represents the previous resistance zone. Therefore, the $224 zone is likely to act as a strong support in the near term.
On the upside, a clear break above the $232 level might start a push towards the $240 zone. If the bulls remain in action, there are chances of an upside break towards the $250 level in the coming sessions.
Looking at the chart, Ethereum price is clearly gaining strength above the $225 level. Therefore, there are high chances of a solid rise towards the $240 and $250 resistance levels. Conversely, if there is a downside correction, the price is likely to find a lot of buying interest near the $224 level.
ETH Technical Indicators
Hourly MACD – The MACD for ETH/USD is gaining momentum in the bullish zone.
Hourly RSI – The RSI for ETH/USD is currently well above the 70 level and in the overbought zone.
Major Support Level – $224
Major Resistance Level – $232
The post Ethereum Price (ETH) Breaks $225, Bitcoin Rallies 8% To $11,600 appeared first on NewsBTC.
source https://www.tokentalk.co/NewsBTC/ethereum-price-eth-breaks-225-bitcoin-rallies-8-to-11600-5d47a8d07be6c31b6def987e
Sunday, 4 August 2019
Ethereum Price (ETH) Breaks $225, Bitcoin Rallies 8% To $11,600 @newsbtc #Analysis #Technical #ETH #ethereum
Subscribe to:
Post Comments (Atom)
This analyst says there’s a “high chance” Bitcoin may never fall under $5k again @cryptoslate #Analysis #Price Watch
Once Bitcoin (BTC) started to incur strong losses in the second half of 2019, analysts were once again making extremely low price prediction...

-
The Indian Ministry of Commerce and Industry announced yesterday that the Coffee Board in the country is integrating blockchain into the cof...
-
App-enabled cryptocurrency exchange and wallet provider, Zebpay, has announced that it is enabling Lightning Network payments for all its ...
-
Once Bitcoin (BTC) started to incur strong losses in the second half of 2019, analysts were once again making extremely low price prediction...


No comments:
Post a Comment