- ETH price extended gains above the $230 resistance and climbed above $235 against the US Dollar.
- The price tested the $237 level and it is currently correcting gains.
- There are two bullish trend ...
- ETH price extended gains above the $230 resistance and climbed above $235 against the US Dollar.
- The price tested the $237 level and it is currently correcting gains.
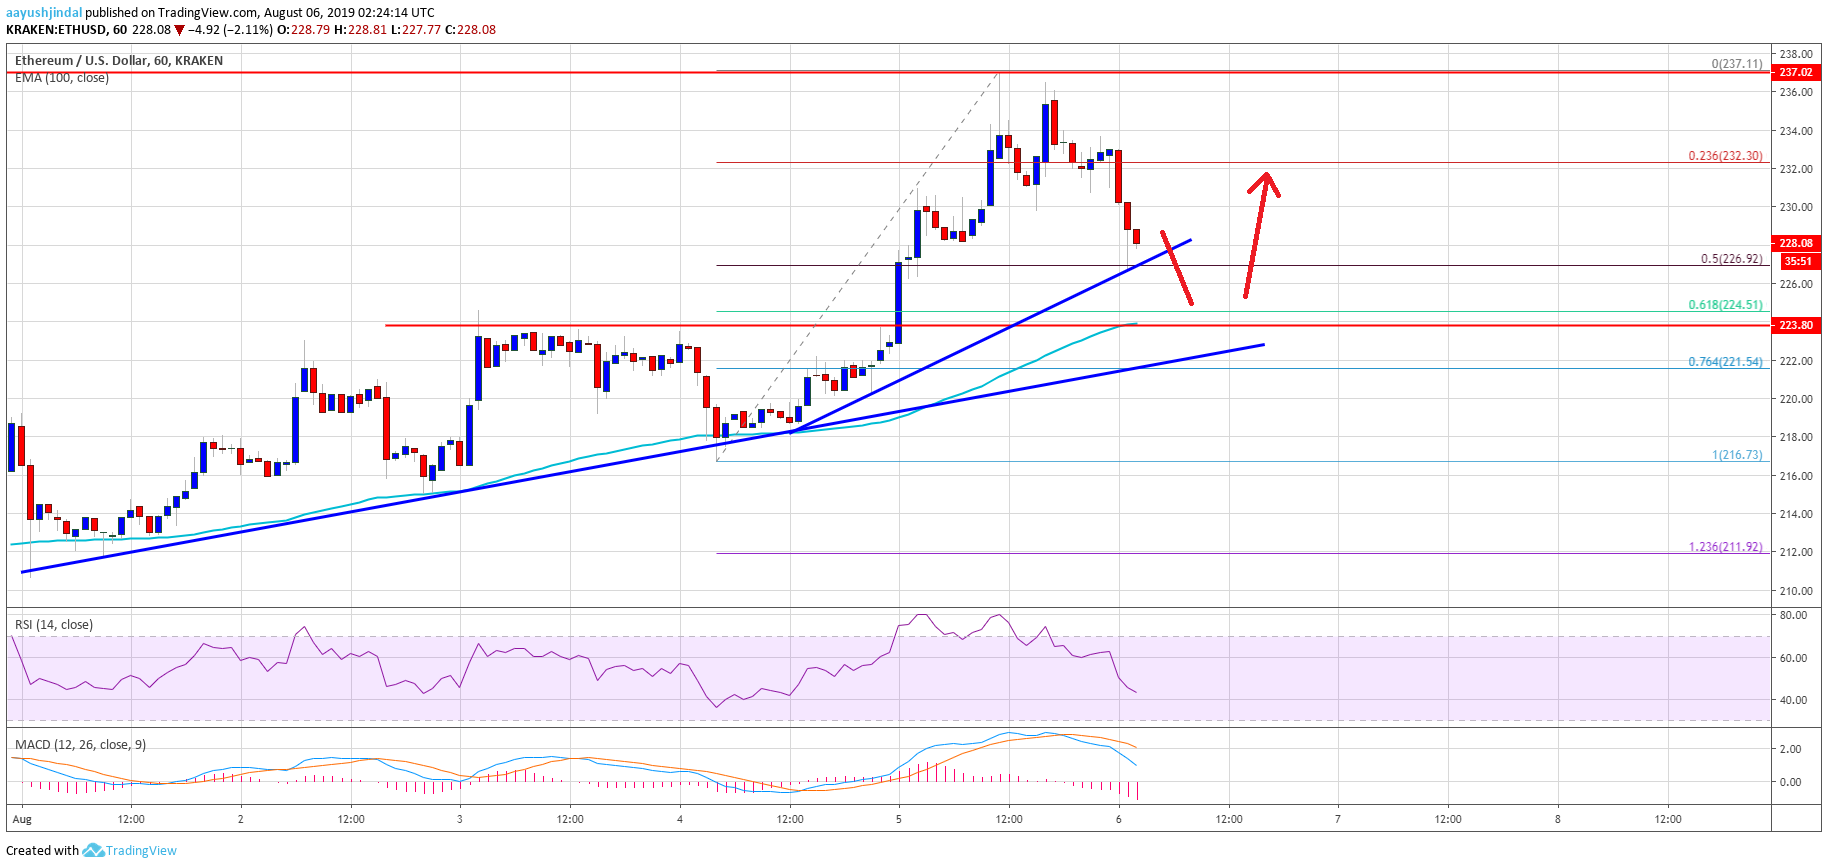
- There are two bullish trend lines forming with support near $226 and $222 on the hourly chart of ETH/USD (data feed via Kraken).
- The pair could find a strong buying interest near the $224 and $225 support levels in the near term.
Ethereum price is correcting gains from $237 versus the US Dollar, and bitcoin is holding $11,500. ETH price could test the main $224 support in the near term, where the bulls might take a stand.
Ethereum Price Analysis
Yesterday, we saw a nice upward move in bitcoin and Ethereum price above $11,500 and $220 respectively against the US Dollar. The ETH/USD pair extended gains above the $230 resistance and traded to a new weekly high. Moreover, there was a break above the $235 level and a swing high was formed near $237. Recently, the price started a downside correction below $235, but it remains well above the 100 hourly simple moving average.
It traded below the 23.6% Fib retracement level of the recent wave from the $216 low to $237 high. Moreover, there was a break below the $230 level. However, the $227 level is currently holding the decline. It represents the 50% Fib retracement level of the recent wave from the $216 low to $237 high. More importantly, there are two bullish trend lines forming with support near $226 and $222 on the hourly chart of ETH/USD.
If there is a downside break below the first trend line, the price could revisit the main $224 and $225 support levels. The 100 hourly SMA is also near the $224 support to act as a strong buy zone. Therefore, dips towards the $224 level remains well supported. Only a downside break below the second trend line and $220 might start a fresh bearish wave.
On the upside, an initial resistance is near the $232 level. A successful close above the $232 level might start a decent upward move in the coming sessions. The next key resistances are near $238 and $240.
Looking at the chart, Ethereum price is clearly correcting gains from the $237 swing high. However, the price is likely to find a strong buying interest near the $224 and $225 support levels. On the upside, the bulls may target the $250 level in the coming days.
ETH Technical Indicators
Hourly MACD – The MACD for ETH/USD is gaining pace in the bearish zone.
Hourly RSI – The RSI for ETH/USD is currently below the 50 level, with a bearish angle.
Major Support Level – $224
Major Resistance Level – $232
The post Ethereum Price (ETH) Correcting Gains: Dips Favored Near $224 appeared first on NewsBTC.
source https://www.tokentalk.co/NewsBTC/ethereum-price-eth-correcting-gains-dips-favored-near-224-5d48ee217be6c31b6def98e2
Tuesday, 6 August 2019
Ethereum Price (ETH) Correcting Gains: Dips Favored Near $224 @newsbtc #Analysis #Technical #ETH #ethereum
Subscribe to:
Post Comments (Atom)
This analyst says there’s a “high chance” Bitcoin may never fall under $5k again @cryptoslate #Analysis #Price Watch
Once Bitcoin (BTC) started to incur strong losses in the second half of 2019, analysts were once again making extremely low price prediction...

-
The Indian Ministry of Commerce and Industry announced yesterday that the Coffee Board in the country is integrating blockchain into the cof...
-
App-enabled cryptocurrency exchange and wallet provider, Zebpay, has announced that it is enabling Lightning Network payments for all its ...
-
Once Bitcoin (BTC) started to incur strong losses in the second half of 2019, analysts were once again making extremely low price prediction...


No comments:
Post a Comment