- Ripple price traded close to the $0.3320 resistance level before declining sharply against the US dollar.
- The price is currently correcting higher after it traded as low as $0.3065.
- There is a ke...
- Ripple price traded close to the $0.3320 resistance level before declining sharply against the US dollar.
- The price is currently correcting higher after it traded as low as $0.3065.
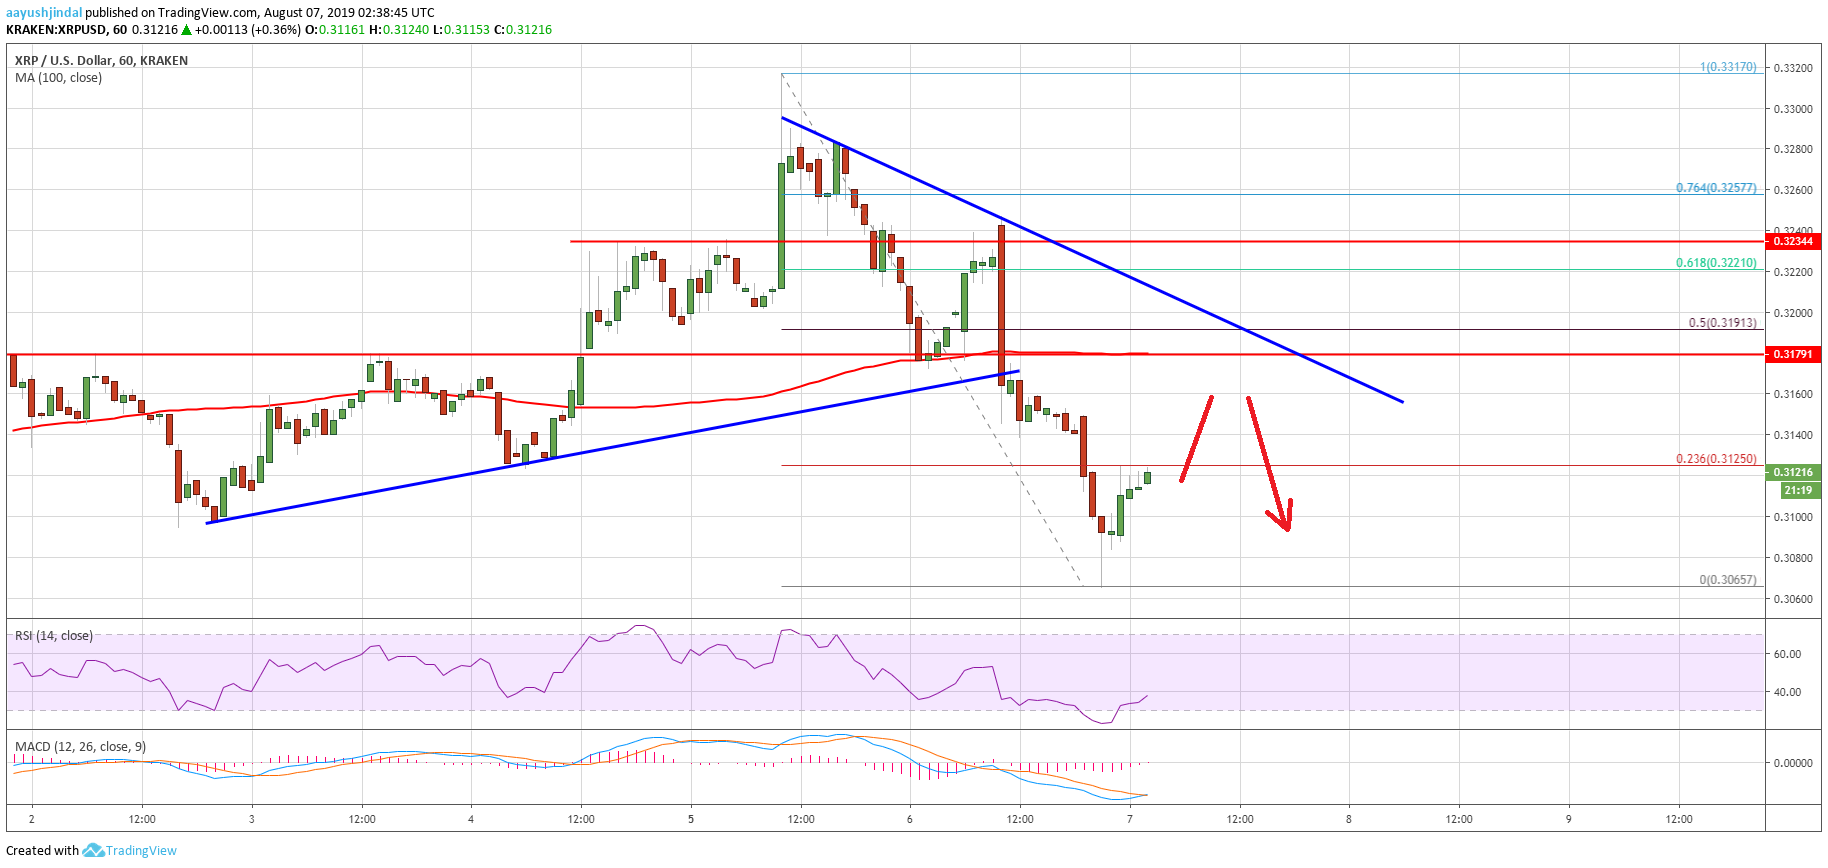
- There is a key resistance forming near $0.3180 and a bearish trend line on the hourly chart of the XRP/USD pair (data source from Kraken).
- The price might correct higher, but it is likely to struggle near the $0.3180 and $0.3200 resistances.
Ripple price is facing a lot of hurdles against the US Dollar, while bitcoin is holding an important support. XRP price is likely to face a strong selling interest near the $0.3200 resistance area.
Ripple Price Analysis
Recently, there was a decent rise in ripple price above the $0.3220 resistance against the US Dollar, coupled with gains in Ethereum and bitcoin. The XRP/USD pair climbed above the $0.3300 level and the 100 hourly simple moving average. However, the bulls failed to clear the $0.3320 resistance area. A swing high was formed near $0.3317 and the price started a sharp decline.
There was a break below the $0.3250 and $0.3220 support levels. Moreover, the price broke the key $0.3200 support and the 100 hourly simple moving average. Finally, the price dived below the $0.3100 level and traded as low as $0.3065. It is currently correcting higher above $0.3100. An immediate resistance is near the $0.3125 level. Additionally, the 23.6% Fib retracement level of the recent decline from the $0.3317 high to $0.3065 low is also near the $0.3125 level.
On the upside, the main resistance is near the $0.3180 level. More importantly, there is a key resistance forming near $0.3180 and a bearish trend line on the hourly chart of the XRP/USD pair. The 100 hourly SMA is also near the $0.3180 level to act as a resistance. Furthermore, the 50% Fib retracement level of the recent decline from the $0.3317 high to $0.3065 low is at $0.3191.
Therefore, the price is likely to face a lot of resistance near the $0.3180 and $0.3200 levels. A successful close above $0.3200 is needed for a fresh increase above $0.3220 in the near term.
Looking at the chart, ripple price seems to be back below a few important supports such as $0.3220 and $0.3200. As long as there is no close above $0.3200, the price could struggle to gain bullish momentum. On the downside, the key supports are near $0.3080, $0.3065 and $0.3020.
Technical Indicators
Hourly MACD – The MACD for XRP/USD is about to move into the bullish zone.
Hourly RSI (Relative Strength Index) – The RSI for XRP/USD is currently climbing higher towards the 50 level.
Major Support Levels – $0.3080, $0.3065 and $0.3020.
Major Resistance Levels – $0.3180, $0.3200 and $0.3220.
The post Ripple Price (XRP) Recovery Won’t Be Easy While Bitcoin Takes Hit appeared first on NewsBTC.
source https://www.tokentalk.co/NewsBTC/ripple-price-xrp-recovery-wont-be-easy-while-bitcoin-takes-hit-5d4a4db018b5100e6a798a1e
Tuesday, 6 August 2019
Ripple Price (XRP) Recovery Won’t Be Easy While Bitcoin Takes Hit @newsbtc #Analysis #Technical #Ripple #xrp
Subscribe to:
Post Comments (Atom)
This analyst says there’s a “high chance” Bitcoin may never fall under $5k again @cryptoslate #Analysis #Price Watch
Once Bitcoin (BTC) started to incur strong losses in the second half of 2019, analysts were once again making extremely low price prediction...

-
The Indian Ministry of Commerce and Industry announced yesterday that the Coffee Board in the country is integrating blockchain into the cof...
-
App-enabled cryptocurrency exchange and wallet provider, Zebpay, has announced that it is enabling Lightning Network payments for all its ...
-
Once Bitcoin (BTC) started to incur strong losses in the second half of 2019, analysts were once again making extremely low price prediction...


No comments:
Post a Comment