- After setting a new 2019 high near $11,800, bitcoin price declined sharply against the US Dollar.
- The price declined below the key $13,200 and $12,000 supports to trim most gains.
- There is a conn...
- After setting a new 2019 high near $11,800, bitcoin price declined sharply against the US Dollar.
- The price declined below the key $13,200 and $12,000 supports to trim most gains.
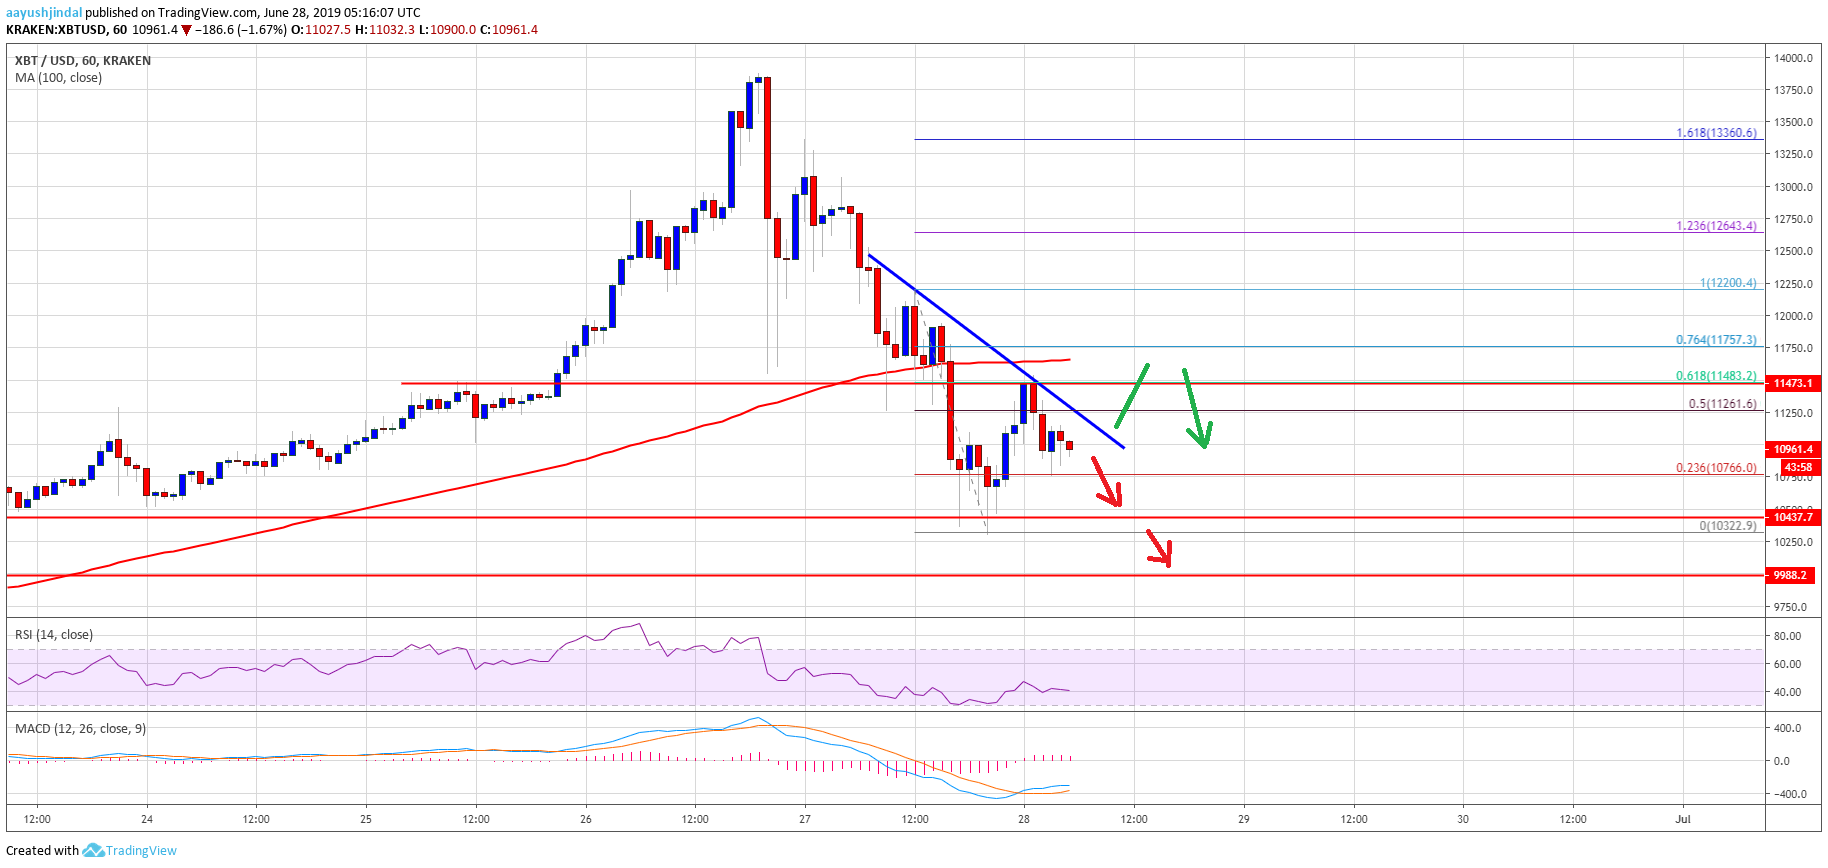
- There is a connecting bearish trend line forming with resistance at $11,100 on the hourly chart of the BTC/USD pair (data feed from Kraken).
- The pair must stay above the $10,450 and $10,000 support levels to start a fresh increase.
Bitcoin price nosedived by more than $2,000 against the US Dollar. BTC is now approaching a couple of important supports near $10,450, $10,200 and $10,000.
Bitcoin Price Analysis
In the past three sessions, bitcoin trimmed most its recent gains from well above $13,000 against the US Dollar. The BTC/USD pair broke the key $12,500 support level to enter a bearish zone. There was even a close below the $11,500 support and the 100 hourly simple moving average. Finally, the price even spiked below the $10,450 support and a new swing low was formed at $10,322.
It recently recovered above the $10,500 and $10,800 levels. Moreover, there was a break above the 50% Fib retracement level of the last decline from the $12,200 swing high to $10,322 low. However, the price struggled to climb above the $11,500 resistance level (the previous support). Besides, the price stayed below the $11,600 pivot and the 100 hourly SMA.
Additionally, the 61.8% Fib retracement level of the last decline from the $12,200 swing high to $10,322 low also prevented gains. More importantly, there is a connecting bearish trend line forming with resistance at $11,100 on the hourly chart of the BTC/USD pair. To start a fresh increase, the price must break the trend line and the $11,500 resistance. Having said that, a successful close above the 100 hourly SMA is needed for more gains towards $12,000 and $12,500.
Conversely, if the price fails to move past $11,500, it could continue to decline. An immediate support is near the $10,450 level. The main supports are near $10,200, $10,000 and $9,980. If there is a break below the $9,980 support, the price could accelerate losses in the near term. The next main support is at $9,920, followed by $8,500.
Looking at the chart, bitcoin price is clearly struggling below the $11,500 and $12,000 levels. However, the $10,000 support level holds the key. As long as BTC price is above the $10,000 support, it could consolidate and then start a fresh increase.
Technical indicators:
Hourly MACD – The MACD is slowly moving in the bullish zone.
Hourly RSI (Relative Strength Index) – The RSI for BTC/USD is now well below the 50 level, with a bearish angle.
Major Support Levels – $10,450 followed by $10,000.
Major Resistance Levels – $11,100, $11,500 and $12,000.
The post Bitcoin Rally Unravels: Here Is Why $10K Holds The Key appeared first on NewsBTC.
source https://www.tokentalk.co/NewsBTC/bitcoin-rally-unravels-here-is-why-10k-holds-the-key-5d15ace05c8e01e04fca10e1
Thursday, 27 June 2019
Bitcoin Rally Unravels: Here Is Why $10K Holds The Key @newsbtc #Analysis #Technical #bitcoin #btc
Subscribe to:
Post Comments (Atom)
This analyst says there’s a “high chance” Bitcoin may never fall under $5k again @cryptoslate #Analysis #Price Watch
Once Bitcoin (BTC) started to incur strong losses in the second half of 2019, analysts were once again making extremely low price prediction...

-
The Indian Ministry of Commerce and Industry announced yesterday that the Coffee Board in the country is integrating blockchain into the cof...
-
App-enabled cryptocurrency exchange and wallet provider, Zebpay, has announced that it is enabling Lightning Network payments for all its ...
-
Disclaimer: These summaries are provided for educational purposes only by Nelson Rosario and Stephen Palley... Disclaimer: These summaries...

No comments:
Post a Comment