- After correcting towards the $10,400 support, bitcoin price recovered above $11,000 against the US Dollar.
- The price broke the $11,800 resistance, but it faced a strong resistance near the $12,400 level.<...
- After correcting towards the $10,400 support, bitcoin price recovered above $11,000 against the US Dollar.
- The price broke the $11,800 resistance, but it faced a strong resistance near the $12,400 level.
- There was a break below an ascending channel with support near $11,800 on the hourly chart of the BTC/USD pair (data feed from Kraken).
- The pair might decline further towards the $11,000 before it could start a fresh increase.
Bitcoin price started a decent recovery above $11,800 against the US Dollar. However, BTC is struggling to settle above $12,000 and the 100 hourly SMA.
Bitcoin Price Analysis
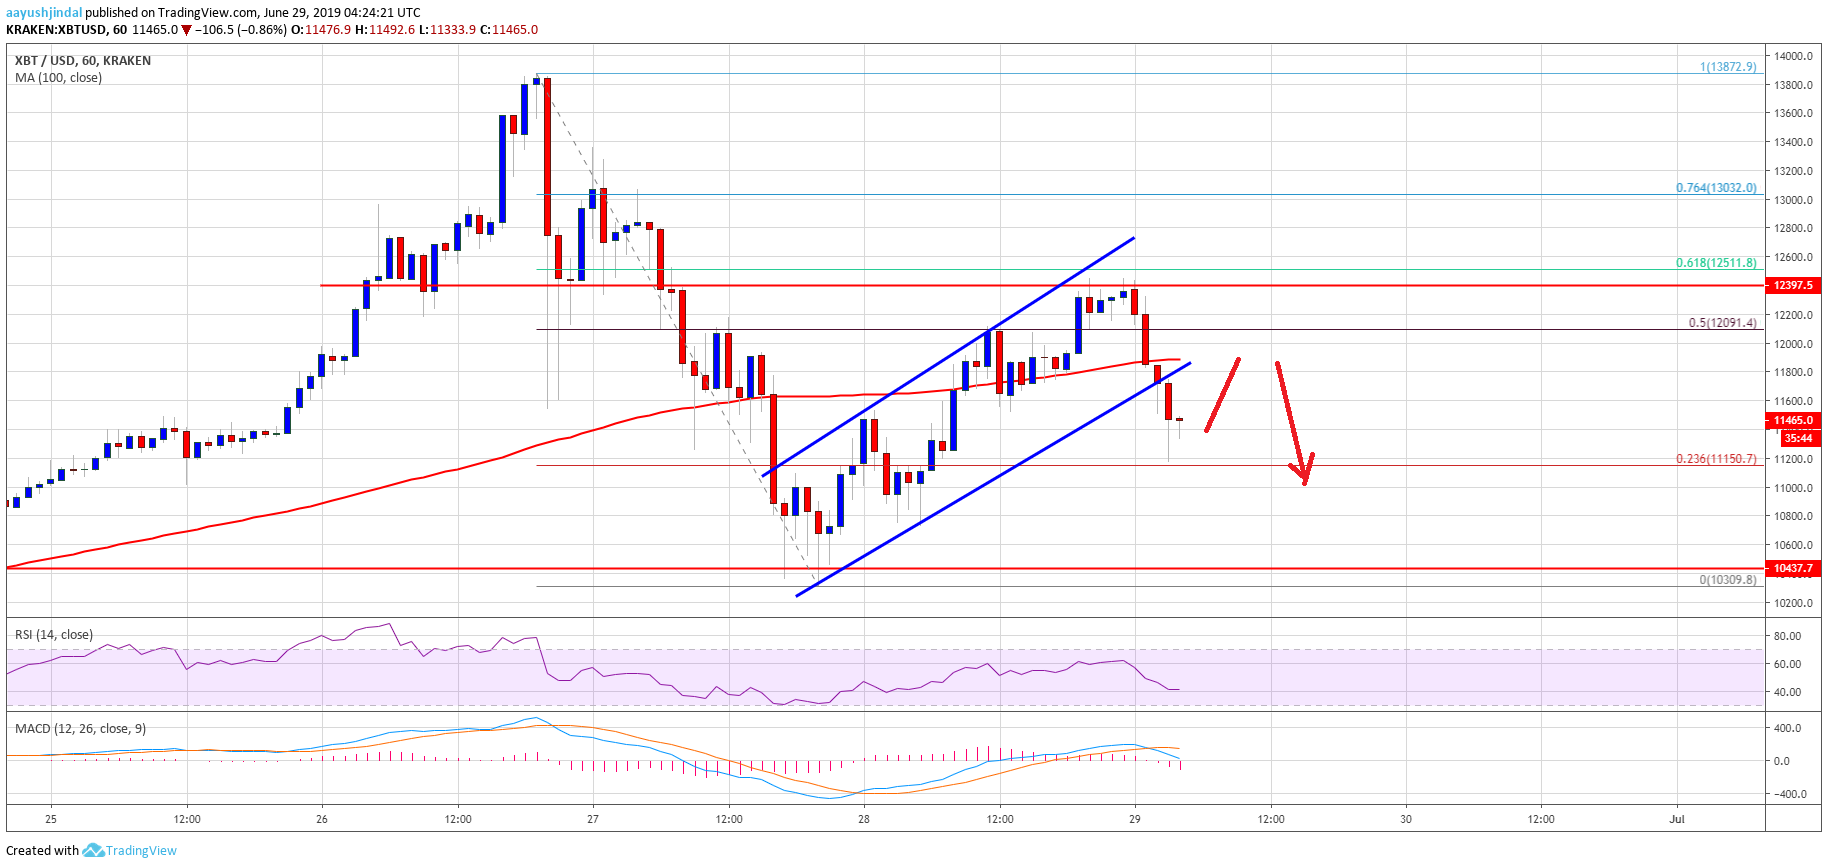
Yesterday, we saw a major decline in bitcoin below the $12,000 and $11,000 supports against the US Dollar. The BTC/USD pair traded close to the $10,000 support area and a swing low was formed near $10,309. A support base was formed above $10,400 and recently the price started an upside correction. It broke the $11,000 resistance to move into a positive zone.
Moreover, the price surpassed the $12,000 level plus the 50% Fib retracement level of the last decline from the $13,872 swing high to $10,309 low. Finally, there was a break above the $12,200 level and the 100 hourly simple moving average. However, the price faced a strong resistance near the $12,400 level. Additionally, the price struggled to test the 61.8% Fib retracement level of the last decline from the $13,872 swing high to $10,309 low. Overall, it topped just below the $12,500 level and recently traded lower.
There was a break below an ascending channel with support near $11,800 on the hourly chart of the BTC/USD pair. The pair is now trading below the $12,000 level and is testing the $11,400 support. It seems like it could correct higher once again towards $12,000. Having said that, it might struggle to surpass the $11,850 level and the 100 hourly SMA.
To start a strong upward move, there must be a close above the $12,000 level and the 100 hourly SMA. If not, there is a risk of a fresh decline below the $11,400 support. The next key support is near the $11,000 level, below which the price might revisit the $10,400 support area.
Looking at the chart, bitcoin price is facing an uphill task below the $12,000 barrier and the 100 hourly SMA. If there is a successful close above $12,000, the price may even attempt to climb above $12,500 in the near term.
Technical indicators:
Hourly MACD – The MACD is slowly moving in the bearish zone.
Hourly RSI (Relative Strength Index) – The RSI for BTC/USD is now well below the 45 level, with a bearish angle.
Major Support Levels – $11,400 followed by $11,000.
Major Resistance Levels – $11,800, $12,000 and $12,500.
The post Bitcoin Rebound Facing Resistance: More Downsides On The Cards? appeared first on NewsBTC.
source https://www.tokentalk.co/NewsBTC/bitcoin-rebound-facing-resistance-more-downsides-on-the-cards-5d16f0515c8e01e04fca1150
Friday, 28 June 2019
Bitcoin Rebound Facing Resistance: More Downsides On The Cards? @newsbtc #Analysis #Technical #bitcoin #btc
Subscribe to:
Post Comments (Atom)
This analyst says there’s a “high chance” Bitcoin may never fall under $5k again @cryptoslate #Analysis #Price Watch
Once Bitcoin (BTC) started to incur strong losses in the second half of 2019, analysts were once again making extremely low price prediction...

-
The Indian Ministry of Commerce and Industry announced yesterday that the Coffee Board in the country is integrating blockchain into the cof...
-
App-enabled cryptocurrency exchange and wallet provider, Zebpay, has announced that it is enabling Lightning Network payments for all its ...
-
Disclaimer: These summaries are provided for educational purposes only by Nelson Rosario and Stephen Palley... Disclaimer: These summaries...

No comments:
Post a Comment