- There was a sharp increase in bitcoin price above the $11,800 and $12,000 resistances against the US Dollar.
- The price surged above $12,200 and even traded to a new 2019 high near $12,500.
- There ...
- There was a sharp increase in bitcoin price above the $11,800 and $12,000 resistances against the US Dollar.
- The price surged above $12,200 and even traded to a new 2019 high near $12,500.
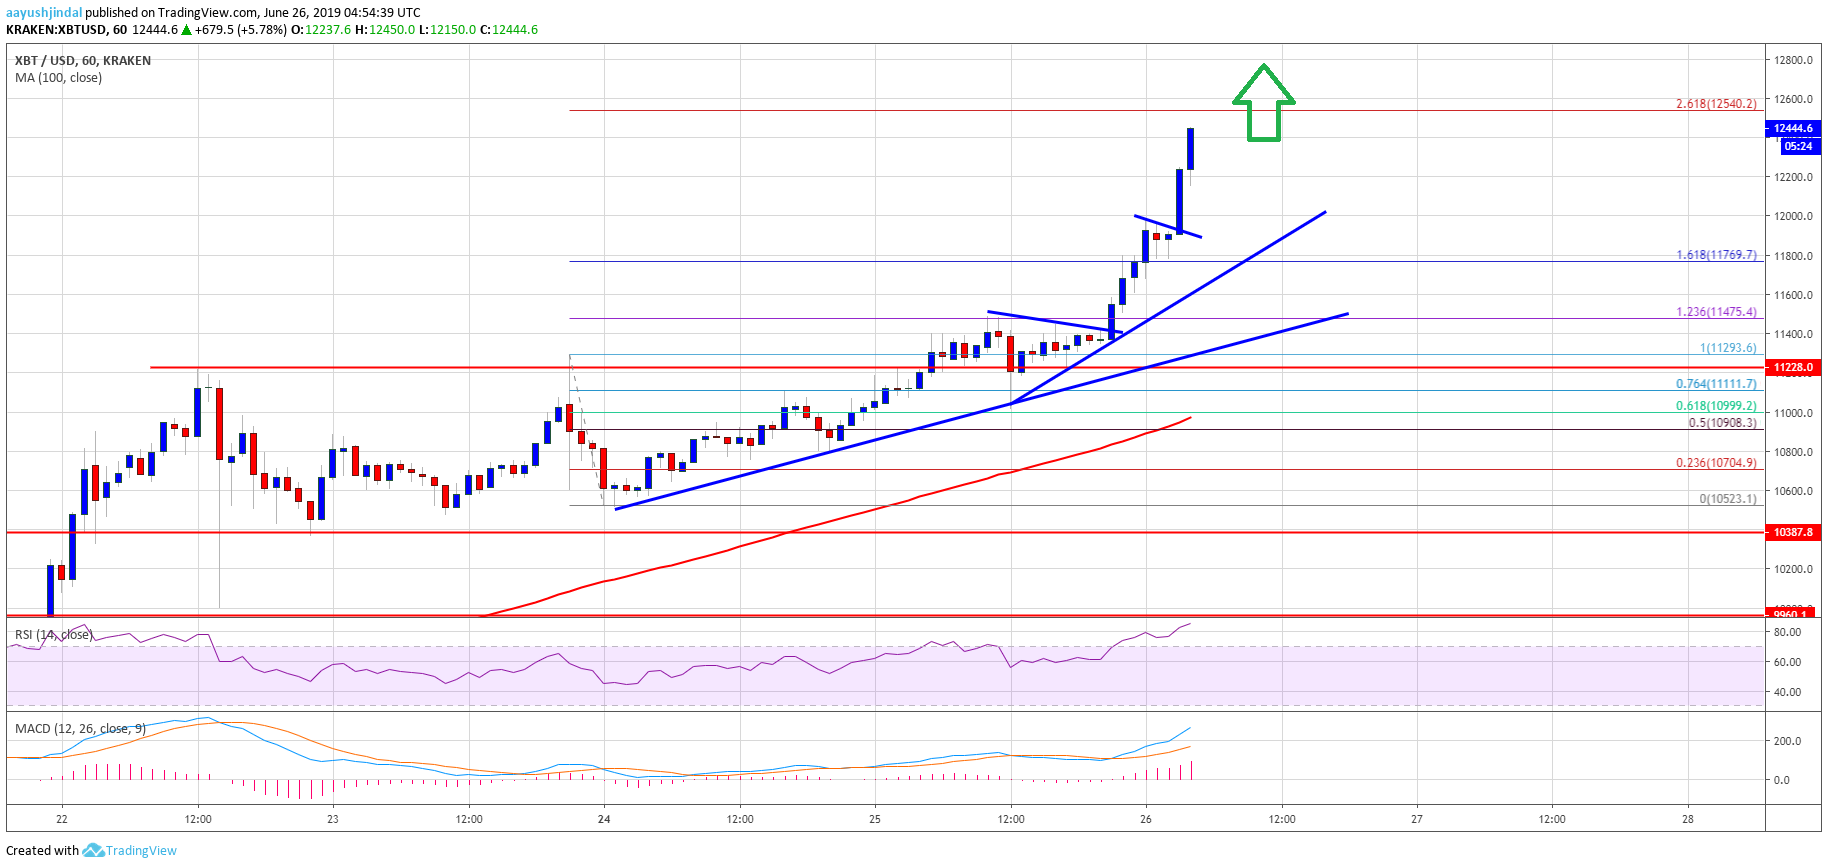
- There are two key bullish trend lines forming with support near $12,000 and $11,450 on the hourly chart of the BTC/USD pair (data feed from Kraken).
- The pair remains in a strong uptrend and it could even climb above $12,550 and $12,750.
Bitcoin price surged above the main $12,000 resistance against the US Dollar. BTC price is currently gaining momentum and it could even trade towards the $13,000 level.
Bitcoin Price Analysis
This week, we discussed the $12,000 level as a possible target for bitcoin against the US Dollar. The BTC/USD pair did remain in a positive zone and recently broke a few important resistances near $11,500 and $11,800. As a result, there was an upside break above $12,000 level and the price traded to our weekly target. The recent wave was such that the price even surged above $12,200 and traded to a new 2019 high near $12,500.
It is now trading well above the 1.236 Fib extension level of the last decline from the $11,295 swing high to $10,525 low. During the rise, the price broke a few important bullish continuation patterns near $11,400 and $12,000. It seems like the price is rallying towards the next possible target near the $12,540 level. It coincides with the 1.618 Fib extension level of the last decline from the $11,295 swing high to $10,525 low.
On the downside, there are many supports near the $12,200 and $12,000 levels. Moreover, there are two key bullish trend lines forming with support near $12,000 and $11,450 on the hourly chart of the BTC/USD pair. Additionally, the main support on the downside is near the $11,225, where the bulls are likely to defend any further losses.
On the upside, if the price breaks the $12,540 resistance, there could be a sharp upward move. Therefore, the next target for the bulls could be near the $13,000 level. If there are more gains, the price may even accelerate towards the $13,500 level in the near term.
Looking at the chart, bitcoin price is gaining a lot of strength above the $12,000 level. The price action is super strong and there seems no reason for a major pullback in the near term. Therefore, there could be more gains above the $12,500 and $12,800 levels.
Technical indicators:
Hourly MACD – The MACD is currently gaining strength in the bullish zone.
Hourly RSI (Relative Strength Index) – The RSI for BTC/USD is now above the 70 level and is in the overbought zone.
Major Support Levels – $12,200 followed by $12,000.
Major Resistance Levels – $12,500, $12,800 and $13,000.
The post Bitcoin Price Smacks $12.5K, BTC’s Bullish Acceleration Could Continue appeared first on NewsBTC.
source https://www.tokentalk.co/NewsBTC/bitcoin-price-smacks-125k-btcs-bullish-acceleration-could-continue-5d1300805c8e01e04fca0fe2
Tuesday, 25 June 2019
Bitcoin Price Smacks $12.5K, BTC’s Bullish Acceleration Could Continue @newsbtc #Analysis #Technical #bitcoin #btc
Subscribe to:
Post Comments (Atom)
This analyst says there’s a “high chance” Bitcoin may never fall under $5k again @cryptoslate #Analysis #Price Watch
Once Bitcoin (BTC) started to incur strong losses in the second half of 2019, analysts were once again making extremely low price prediction...

-
The Indian Ministry of Commerce and Industry announced yesterday that the Coffee Board in the country is integrating blockchain into the cof...
-
App-enabled cryptocurrency exchange and wallet provider, Zebpay, has announced that it is enabling Lightning Network payments for all its ...
-
Once Bitcoin (BTC) started to incur strong losses in the second half of 2019, analysts were once again making extremely low price prediction...


No comments:
Post a Comment