- ETH price topped near the $364 level and declined sharply below $350 against the US Dollar.
- The price is down more than 20% from highs and it is now trading below $310.
- This week’s followed key b...
- ETH price topped near the $364 level and declined sharply below $350 against the US Dollar.
- The price is down more than 20% from highs and it is now trading below $310.
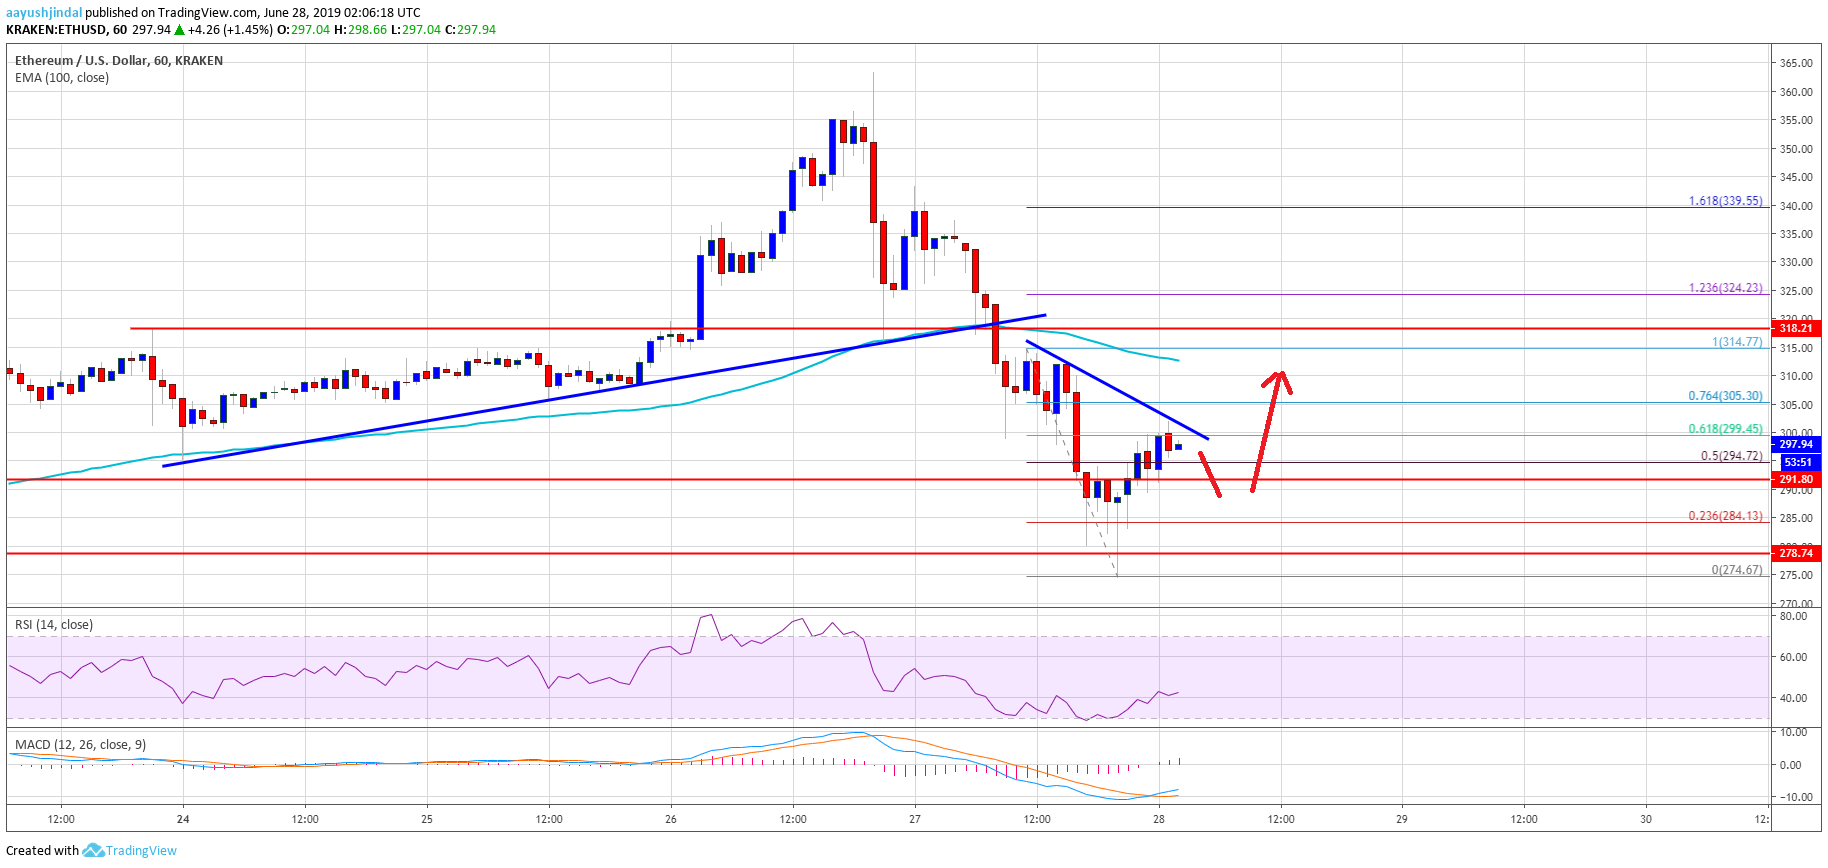
- This week’s followed key bullish trend line was breached with support near $318 on the hourly chart of ETH/USD (data feed via Kraken).
- There were sharp losses noted in bitcoin, ripple, bitcoin cash and a few other major altcoins.
Ethereum price is back in a short term bearish zone versus the US Dollar and bitcoin. ETH price could recover above $300, but it is likely to face resistance near $310 or $320.
Ethereum Price Analysis
In the past few sessions, there was a sharp increase in selling on Ethereum and bitcoin against the US Dollar. The ETH/USD pair topped near the $364 level and declined sharply below $350. It broke the main support near the $320 level and the 100 hourly simple moving average. The decline was such that there was a close below the $320 and $318 pivot levels.
Moreover, this week’s followed key bullish trend line was breached with support near $318 on the hourly chart of ETH/USD. Ethereum price is now trading well below the $310 level and it recently declined towards the $275 level. A swing low was formed near $274 and the price is currently correcting higher. It recovered above $290 plus the 50% Fib retracement level of the recent decline from the $314 high to $274 swing low.
However, Ether is facing a strong resistance near the $300 level. Moreover, the 61.8% Fib retracement level of the recent decline from the $314 high to $274 swing low is acting as a hurdle. More importantly, there is a connecting bearish trend line forming with resistance near $300 on the same chart.
It seems like the price may correct higher above $300 in the short term. However, the bulls are likely to face a strong resistance near the $310 and $315 levels. The main resistance is now near $318 and the 100 hourly SMA. A successful close above $320 is needed for the bulls to gain traction.
Looking at the chart, Ethereum price moved back in a bearish zone below $320 and $310. A convincing recovery won’t be easy above $310 or $320. If the price continues to struggle near $300 or $310, there are chances of a fresh decline towards $280 or $275 in the near term.
ETH Technical Indicators
Hourly MACD – The MACD for ETH/USD is slowly moving in the bullish zone.
Hourly RSI – The RSI for ETH/USD is slowly recovering from 30 and it is currently near 42.
Major Support Level – $280
Major Resistance Level – $310
The post Ethereum (ETH) Price Dives 20%: Recovery Could Be Difficult appeared first on NewsBTC.
source https://www.tokentalk.co/NewsBTC/ethereum-eth-price-dives-20-recovery-could-be-difficult-5d1584915c8e01e04fca10db
Thursday, 27 June 2019
Ethereum (ETH) Price Dives 20%: Recovery Could Be Difficult @newsbtc #Analysis #Technical #ETH #ethereum
Subscribe to:
Post Comments (Atom)
This analyst says there’s a “high chance” Bitcoin may never fall under $5k again @cryptoslate #Analysis #Price Watch
Once Bitcoin (BTC) started to incur strong losses in the second half of 2019, analysts were once again making extremely low price prediction...

-
The Indian Ministry of Commerce and Industry announced yesterday that the Coffee Board in the country is integrating blockchain into the cof...
-
App-enabled cryptocurrency exchange and wallet provider, Zebpay, has announced that it is enabling Lightning Network payments for all its ...
-
Disclaimer: These summaries are provided for educational purposes only by Nelson Rosario and Stephen Palley... Disclaimer: These summaries...

No comments:
Post a Comment