- There was another rejection near the $12,200 resistance in bitcoin price against the US Dollar.
- The price revisited the main $10,500 support area and it is currently correcting higher.
- There is a...
- There was another rejection near the $12,200 resistance in bitcoin price against the US Dollar.
- The price revisited the main $10,500 support area and it is currently correcting higher.
- There is a key connecting bearish trend line forming with resistance near $11,400 on the hourly chart of the BTC/USD pair (data feed from Kraken).
- The pair seems to be forming a double bottom pattern near the $10,400 and $10,500 support levels.
Bitcoin price is holding the main $10,400 support area against the US Dollar. BTC price might start a strong increase if it clears the $11,400 resistance area.
Bitcoin Price Analysis
Recently, there was a decent recovery in bitcoin price above the $11,500 level against the US Dollar. The BTC/USD pair even traded above the $12,000 level and the 100 hourly simple moving average. However, the pair struggled to clear the $12,200 resistance area and it recently declined below $12,000 and $11,500. There was even a spike below the $11,000 level and the price settled below the 100 hourly SMA.
However, the main $10,400 and $10,500 support levels acted as a strong hurdle for sellers. Bitcoin remained above the $10,400 support and it seems to be forming a double bottom pattern. It is currently correcting higher above $11,000 plus the 23.6% Fib retracement level of the last decline from the $12,305 high to $10,616 low. On the upside, there is a major resistance forming near the $11,400 level.
Moreover, there is a key connecting bearish trend line forming with resistance near $11,400 on the hourly chart of the BTC/USD pair. The 50% Fib retracement level of the last decline from the $12,305 high to $10,616 low is also near the $10,460 level to act as a resistance. Finally, the 100 hourly simple moving average is near the $11,650 level to act as a strong resistance.
Once there is a close above the trend line and the 100 hourly SMA, the price could revisit the $12,200 level. On the downside, an initial support is near the $11,000 level, below which there is a risk of a drop towards the $10,600 level. The main support is near the $10,400 level, below which the price could accelerate losses.
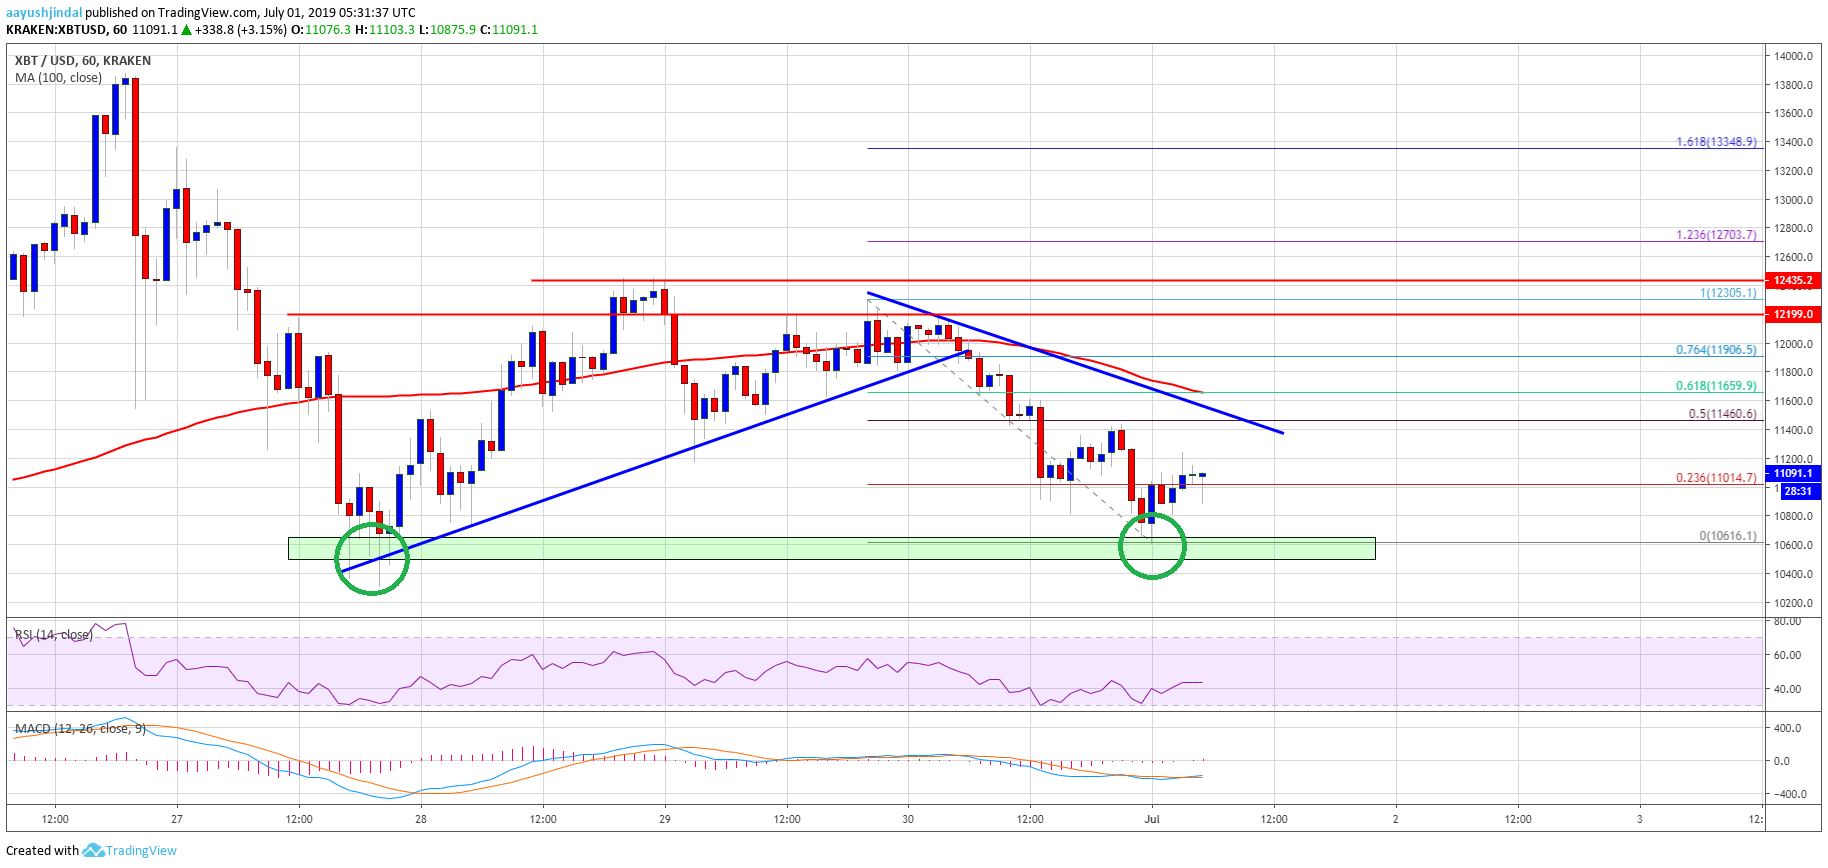
Looking at the chart, bitcoin price is likely forming a double bottom pattern near the $10,400 and $10,500 support levels. As long as it stays above the $10,400 level, there could be a fresh increase above the $11,500 and $11,650 levels.
Technical indicators:
Hourly MACD – The MACD is likely to move into the bullish zone.
Hourly RSI (Relative Strength Index) – The RSI for BTC/USD is just above the 40 level, with a positive angle.
Major Support Levels – $10,600 followed by $10,400.
Major Resistance Levels – $11,400, $11,650 and $12,200.
The post Bitcoin Forming Double Bottom: Can Bulls Gain Momentum? appeared first on NewsBTC.
source https://www.tokentalk.co/NewsBTC/bitcoin-forming-double-bottom-can-bulls-gain-momentum-5d19a0730ca7e3e0246b538b
Sunday, 30 June 2019
Bitcoin Forming Double Bottom: Can Bulls Gain Momentum? @newsbtc #Analysis #Technical #bitcoin #btc
Subscribe to:
Post Comments (Atom)
This analyst says there’s a “high chance” Bitcoin may never fall under $5k again @cryptoslate #Analysis #Price Watch
Once Bitcoin (BTC) started to incur strong losses in the second half of 2019, analysts were once again making extremely low price prediction...

-
The Indian Ministry of Commerce and Industry announced yesterday that the Coffee Board in the country is integrating blockchain into the cof...
-
App-enabled cryptocurrency exchange and wallet provider, Zebpay, has announced that it is enabling Lightning Network payments for all its ...
-
Disclaimer: These summaries are provided for educational purposes only by Nelson Rosario and Stephen Palley... Disclaimer: These summaries...

No comments:
Post a Comment