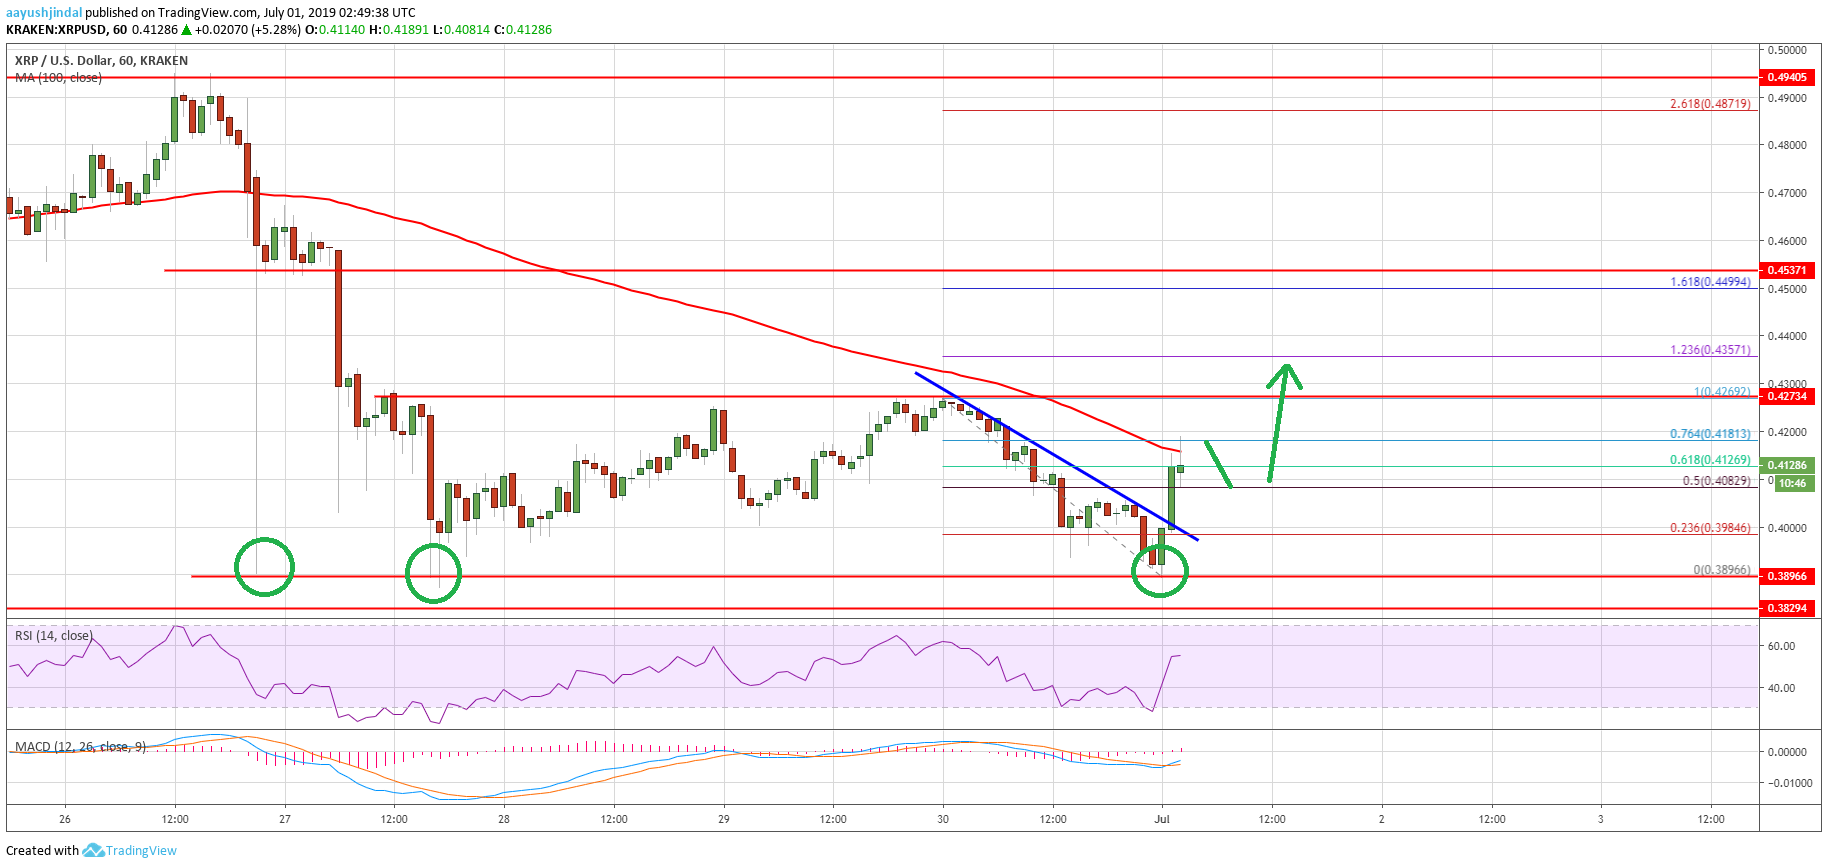
- Ripple price retested the main $0.3900 support area and climbed higher against the US dollar.
- The price is likely forming a decent support base above $0.3900 and it might rise in the near term.
- T...
- Ripple price retested the main $0.3900 support area and climbed higher against the US dollar.
- The price is likely forming a decent support base above $0.3900 and it might rise in the near term.
- There was a break above a major bearish trend line with resistance near $0.4000 on the hourly chart of the XRP/USD pair (data source from Kraken).
- Ethereum price is holding the key $290 support, but it seems to be facing many hurdles near $305-310.
Ripple price is likely forming a strong support base near $0.3900 against the US Dollar, while bitcoin declined heavily. XRP price could continue to rise if it clears the $0.4275 resistance.
Ripple Price Analysis
In the past few hours, bitcoin price declined more than 8% below $11,500, but ripple price was stable against the US Dollar. Earlier, the XRP/USD pair declined towards the main $0.3900 support area and settled below the 100 hourly simple moving average. However, the $0.3900 zone acted as a strong barrier for sellers and the price stayed above $0.3900.
It seems like a solid support base is forming near $0.3900. Recently, the price started an upward move and broke the $0.4000 resistance. Moreover, the price surpassed the 50% Fib retracement level of the last decline from the $0.4269 high to $0.3896 low. More importantly, there was a break above a major bearish trend line with resistance near $0.4000 on the hourly chart of the XRP/USD pair.
Ripple price is now trading near the $0.4110 level. It tested the $0.4200 resistance and the 100 hourly SMA. Moreover, the 76.4% Fib retracement level of the last decline from the $0.4269 high to $0.3896 low is also acting as a resistance. If there is an upside break above the $0.4200 resistance, the price could test the $0.4275 resistance.
If there are more gains above $0.4275, there are chances of an upside break above the $0.4300 level. The next main hurdles are near $0.4450 and $0.4500. Conversely, if the price fails to clear the $0.4275 resistance, it could decline once again. An initial support is near the $0.4000 level.
 a
aLooking at the chart, ripple price is clearly forming a strong support near the $0.3900 level. As long as the price is above $0.3900 and $0.4000, there are chances of a fresh increase above the $0.4275 resistance. If there is a downside break below $0.3900, the price could slide towards $0.3500.
Technical Indicators
Hourly MACD – The MACD for XRP/USD is moving back in the bullish zone.
Hourly RSI (Relative Strength Index) – The RSI for XRP/USD is currently moving higher and it is above the 50 level.
Major Support Levels – $0.4000, $0.3900 and $0.3500.
Major Resistance Levels – $0.4200, $0.4275 and $0.4400.
The post Bitcoin Slides While Ripple Price (XRP) Likely Forming Bottom appeared first on NewsBTC.
source https://www.tokentalk.co/NewsBTC/bitcoin-slides-while-ripple-price-xrp-likely-forming-bottom-5d1987210ca7e3e0246b5387
Sunday, 30 June 2019
Bitcoin Slides While Ripple Price (XRP) Likely Forming Bottom @newsbtc #Analysis #Technical #Ripple #xrp
Subscribe to:
Post Comments (Atom)
This analyst says there’s a “high chance” Bitcoin may never fall under $5k again @cryptoslate #Analysis #Price Watch
Once Bitcoin (BTC) started to incur strong losses in the second half of 2019, analysts were once again making extremely low price prediction...

-
The Indian Ministry of Commerce and Industry announced yesterday that the Coffee Board in the country is integrating blockchain into the cof...
-
App-enabled cryptocurrency exchange and wallet provider, Zebpay, has announced that it is enabling Lightning Network payments for all its ...
-
Disclaimer: These summaries are provided for educational purposes only by Nelson Rosario and Stephen Palley... Disclaimer: These summaries...

No comments:
Post a Comment