- After a nasty upward move, bitcoin price corrected below $12,000 against the US Dollar.
- The price towards the $10,400 support and recently started a fresh increase above $11,500.
- There is a major...
- After a nasty upward move, bitcoin price corrected below $12,000 against the US Dollar.
- The price towards the $10,400 support and recently started a fresh increase above $11,500.
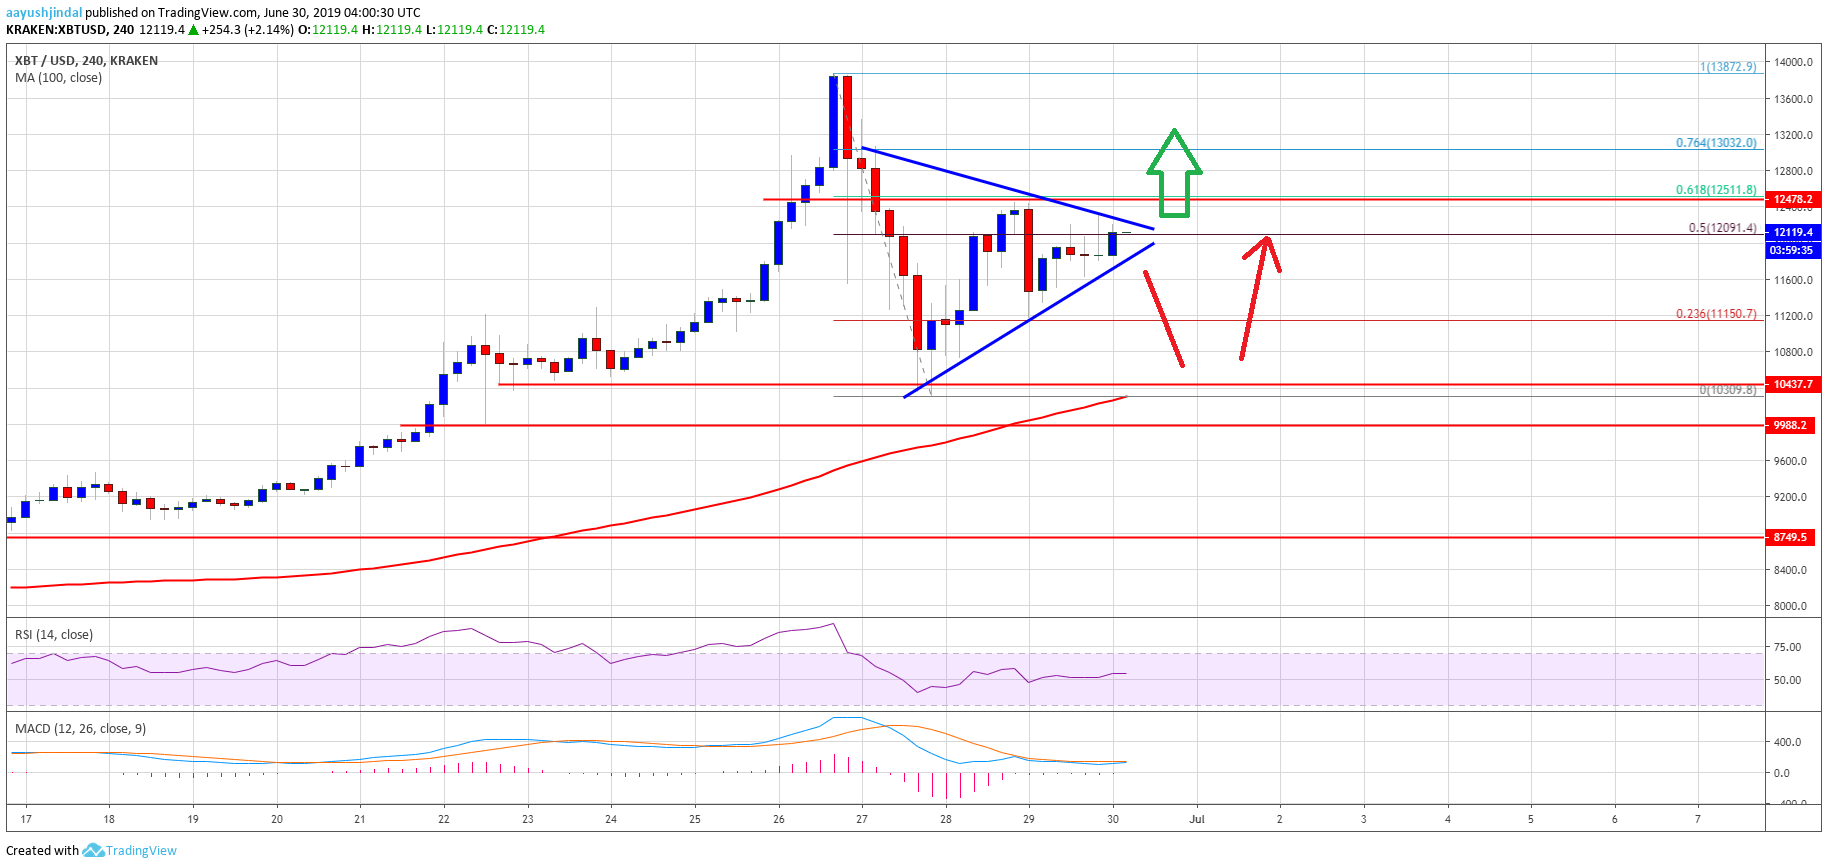
- There is a major contracting triangle forming with resistance near $12,300 on the 4-hours chart of the BTC/USD pair (data feed from Kraken).
- The pair is likely to break to the upside above the $12,400, $12,500 and $12,800 resistance levels.
Bitcoin price is showing a lot of positive signs above $11,600 against the US Dollar. BTC could continue to gain momentum once it clears the key $12,500 resistance area.
Bitcoin Price Weekly Analysis (BTC)
This past week, bitcoin price traded higher sharply above the $11,000 and $12,000 resistances against the US Dollar. The BTC/USD pair even gained strength above the $13,000 level and traded close to the $14,000 level. A new 2019 high was formed near $13,875 and later the price started a sharp downside correction. There was a sharp dip below the $12,000 and $11,000 level.
Moreover, the price traded close to the $10,000 level and the 100 simple moving average (4-hours). Finally, the $10,400 level acted as a strong support and the price stayed well above the 100 SMA. A swing low was formed near $10,310 and the price recently started a fresh increase. It traded above the 50% Fib retracement level of the recent decline from the $13,875 high to $10,310 low.
In addition, bitcoin price managed to settle above the $12,000 level. More importantly, there is a major contracting triangle forming with resistance near $12,300 on the 4-hours chart of the BTC/USD pair. The 61.8% Fib retracement level of the recent decline from the $13,875 high to $10,310 low is near the $12,500 level. Therefore, an upside break above the $12,400 and $12,500 levels is needed for more gains.
Once there is a close above the $12,500 level, the price may accelerate above the $12,800 and $13,000 levels. The next key resistance is near the $13,300 level, followed by $13,650.
On the downside, there is a strong support forming near the $12,000 level. If the price fails to break the $12,500 resistance, it could correct lower. An immediate support is near the $11,600 level, below which bitcoin could trade towards the $11,200 support.
Looking at the chart, bitcoin price is clearly preparing for the next break either above $12,500 or below $12,000. There are high chances of an upside break above $12,500. If not, the price could retest $11,200 before a fresh increase.
Technical indicators
4 hours MACD – The MACD for BTC/USD is slowly moving back in the bullish zone.
4 hours RSI (Relative Strength Index) – The RSI for BTC/USD is currently just above the 50 level.
Major Support Level – $12,000
Major Resistance Level – $12,500
The post Bitcoin Rebounds Nicely, BTC Bulls Sighting Next Crucial Break appeared first on NewsBTC.
source https://www.tokentalk.co/NewsBTC/bitcoin-rebounds-nicely-btc-bulls-sighting-next-crucial-break-5d1841d15c8e01e04fca118b
Sunday, 30 June 2019
Bitcoin Rebounds Nicely, BTC Bulls Sighting Next Crucial Break @newsbtc #Analysis #Technical #bitcoin #btc
Subscribe to:
Post Comments (Atom)
This analyst says there’s a “high chance” Bitcoin may never fall under $5k again @cryptoslate #Analysis #Price Watch
Once Bitcoin (BTC) started to incur strong losses in the second half of 2019, analysts were once again making extremely low price prediction...

-
The Indian Ministry of Commerce and Industry announced yesterday that the Coffee Board in the country is integrating blockchain into the cof...
-
App-enabled cryptocurrency exchange and wallet provider, Zebpay, has announced that it is enabling Lightning Network payments for all its ...
-
Disclaimer: These summaries are provided for educational purposes only by Nelson Rosario and Stephen Palley... Disclaimer: These summaries...

No comments:
Post a Comment