- After a downside correction, bitcoin price fond support near the $10,800 level against the US Dollar.
- There was a decent recovery in the past two sessions and the price traded above $11,300.
- Ther...
- After a downside correction, bitcoin price fond support near the $10,800 level against the US Dollar.
- There was a decent recovery in the past two sessions and the price traded above $11,300.
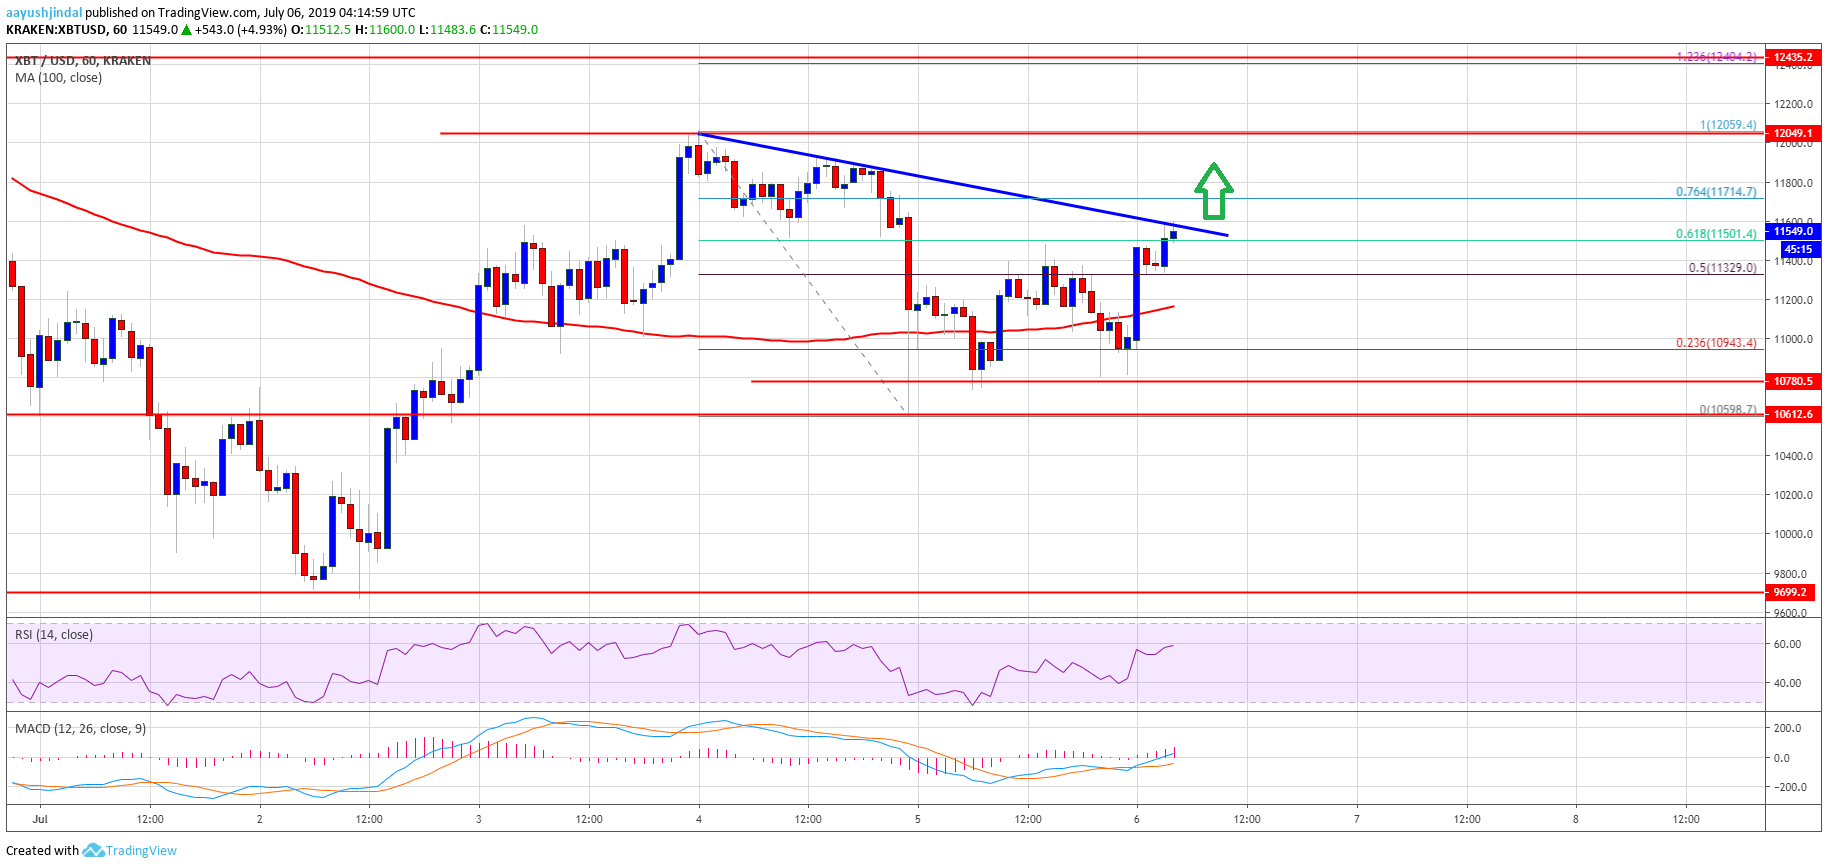
- There is a key bearish trend line forming with resistance near $11,600 on the hourly chart of the BTC/USD pair (data feed from Kraken).
- Ethereum is still trading below $300 and ripple price is struggling to climb higher.
Bitcoin price is showing positive signs above the $11,200 level against the US Dollar. BTC could surge higher once it breaks the $11,600 resistance level in the near term.
Bitcoin Price Analysis
Recently, we saw a downside correction in bitcoin price below $11,200 and $11,000 against the US Dollar. The BTC/USD pair spiked below the $10,800 level, but later recovered nicely. There was a successful close above the $11,000 pivot level to start a decent upward move. Besides, losses were limited in Ethereum, ripple and other altcoins, but they failed to climb similar to BTC.
The price is now trading nicely above the $11,200 level and the 100 hourly simple moving average. Moreover, there was a break above the 23.6% Fib retracement level of the last drop from the $12,055 swing high towards the $10,800 support area. The price is now trading above the $11,500 level, but facing resistance near the $11,600 level. Moreover, there is a key bearish trend line forming with resistance near $11,600 on the hourly chart of the BTC/USD pair.
Above the trend line, the next resistance is near the $11,700 level. The 76.4% Fib retracement level of the last drop from the $12,055 swing high towards the $10,800 support area is also near the $11,700 level. If there is an upside break above the $11,600 and $11,700 levels, there could be strong gains in the coming sessions. Bitcoin price could easily break the $11,800 and $12,000 levels to continue higher.
Conversely, if there is no upside break, the price may correct lower once again below $11,500 and $11,400. An initial support is near the $11,200 level, below which the price may perhaps test the $11,000 support area.
Looking at the chart, bitcoin price is clearly showing a lot of positive signs above $11,200 and $11,400 levels. Therefore, an upside break above $11,600 is very likely. If the bulls gain momentum, we may also witness a new swing high above the $12,000 level.
Technical indicators:
Hourly MACD – The MACD is slowly gaining pace in the bullish zone.
Hourly RSI (Relative Strength Index) – The RSI for BTC/USD is currently nicely above the 50 level, with a positive angle.
Major Support Levels – $11,400 followed by $11,200.
Major Resistance Levels – $11,600, $11,700 and $12,000.
The post Bitcoin (BTC) Price Showing Positive Signs: Bulls Sighting Bullish Break appeared first on NewsBTC.
source https://www.tokentalk.co/NewsBTC/bitcoin-btc-price-showing-positive-signs-bulls-sighting-bullish-break-5d2022618a91e10023114aa5
Saturday, 6 July 2019
Bitcoin (BTC) Price Showing Positive Signs: Bulls Sighting Bullish Break @newsbtc #Analysis #Technical #bitcoin #btc
Subscribe to:
Post Comments (Atom)
This analyst says there’s a “high chance” Bitcoin may never fall under $5k again @cryptoslate #Analysis #Price Watch
Once Bitcoin (BTC) started to incur strong losses in the second half of 2019, analysts were once again making extremely low price prediction...

-
The Indian Ministry of Commerce and Industry announced yesterday that the Coffee Board in the country is integrating blockchain into the cof...
-
App-enabled cryptocurrency exchange and wallet provider, Zebpay, has announced that it is enabling Lightning Network payments for all its ...
-
Ripple price climbed higher recently above the $0.2450 and $0.2500 resistances against the US dollar. The price is currently trading near ...


No comments:
Post a Comment