- Bitcoin price is currently consolidating above the key $9,300 support area against the US Dollar.
- The price is facing a few key resistances near the $9,500, $9,600 and $9,650 levels.
- There is a c...
- Bitcoin price is currently consolidating above the key $9,300 support area against the US Dollar.
- The price is facing a few key resistances near the $9,500, $9,600 and $9,650 levels.
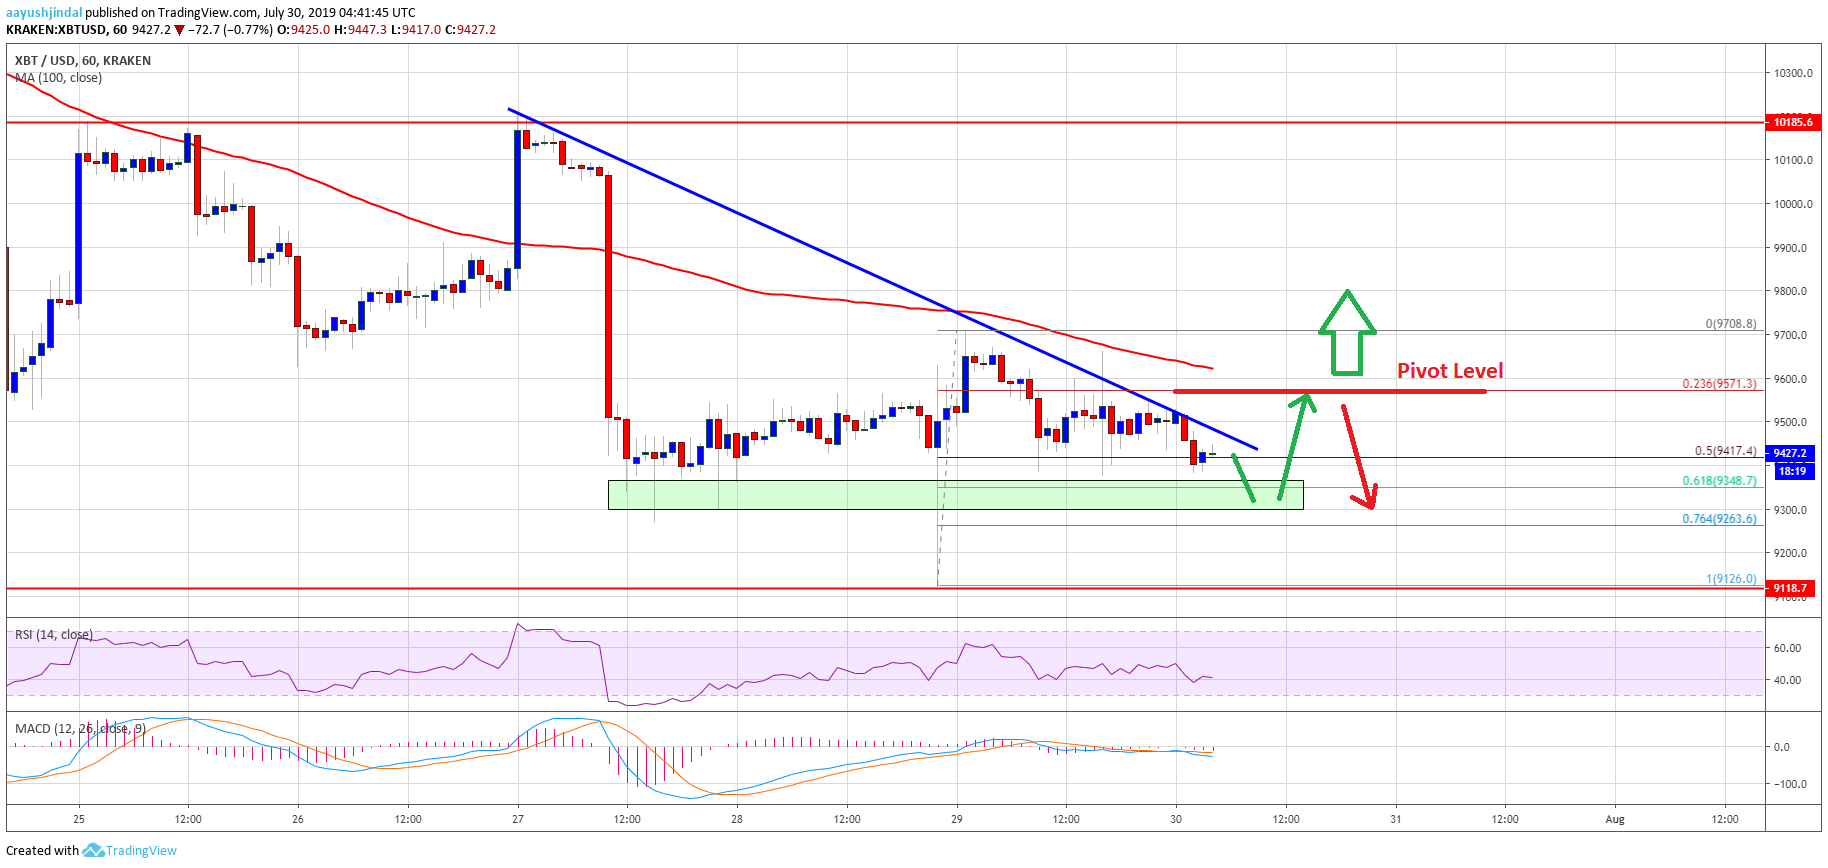
- There is a connecting bearish trend line forming with resistance near $9,500 on the hourly chart of the BTC/USD pair (data feed from Kraken).
- The price start a decent recovery as long as there is no downside break below the $9,300 support.
After bearish moves, bitcoin price started consolidating above $9,300 against the US Dollar. However, BTC must gain momentum above $9,650 to start an upward move.
Bitcoin Price Analysis
After a sharp decline, bitcoin price found support near the $9,120 level against the US Dollar. The BTC/USD pair traded as low as $9,126 and recovered above the $9,300 and $9,500 levels. Additionally, the pair climbed above $9,600, but it struggled to surpass the $9,700 resistance. More importantly, there was no break above the 100 hourly simple moving average (similar to Ethereum and ripple), which is currently near $9,650.
The price topped near the $9,708 level and recently corrected lower. It broke the $9,600 support level plus the 23.6% Fib retracement level of the upside move from the $9,126 low to $9,708 high. Moreover, the price traded below the $9,500 level, but the $9,400 area seems to be acting as a decent support. The 50% Fib retracement level of the upside move from the $9,126 low to $9,708 high is also acting as a support.
The main support is near the $9,300 area. Therefore, a downside break and close below the $9,300 support might push the price further lower. The next support is near $9,125, below which there is a risk of more losses below the $9,000 handle.
On the upside, there are many hurdles near the $9,500, $9,600 and $9,650 levels. Additionally, there is a connecting bearish trend line forming with resistance near $9,500 on the hourly chart of the BTC/USD pair. The key resistance is near the $9,650 level and the 100 hourly SMA. If there is a successful break above $9,600 and a follow through above $9,700, the price could start a solid upward move.
Looking at the chart, bitcoin price is likely to start a slow and steady recovery above $9,600 and $9,700 as long as there is no bearish break below the $9,300 support level. In the bullish scenario, the price may perhaps recover towards the $10,000 and $10,200 resistance levels.
Technical indicators:
Hourly MACD – The MACD is still placed in the bearish zone.
Hourly RSI (Relative Strength Index) – The RSI for BTC/USD is currently well below the 50 level, with bearish signs.
Major Support Levels – $9,300 followed by $9,125.
Major Resistance Levels – $9,500, $9,650 and $9,700.
The post Bitcoin Price (BTC/USD) Holding Key Support But Lacks Momentum appeared first on NewsBTC.
source https://www.tokentalk.co/NewsBTC/bitcoin-price-btcusd-holding-key-support-but-lacks-momentum-5d3fdbf17be5bcbd3bc16204
Monday, 29 July 2019
Bitcoin Price (BTC/USD) Holding Key Support But Lacks Momentum @newsbtc #Analysis #Technical #bitcoin #btc
Subscribe to:
Post Comments (Atom)
This analyst says there’s a “high chance” Bitcoin may never fall under $5k again @cryptoslate #Analysis #Price Watch
Once Bitcoin (BTC) started to incur strong losses in the second half of 2019, analysts were once again making extremely low price prediction...

-
The Indian Ministry of Commerce and Industry announced yesterday that the Coffee Board in the country is integrating blockchain into the cof...
-
App-enabled cryptocurrency exchange and wallet provider, Zebpay, has announced that it is enabling Lightning Network payments for all its ...
-
Disclaimer: These summaries are provided for educational purposes only by Nelson Rosario and Stephen Palley... Disclaimer: These summaries...

No comments:
Post a Comment