- Ripple price recovered recently above $0.3100, but struggled to break $0.3140 against the US dollar.
- The price is currently declining and it might even break the $0.3050 support area in the near term.
- Ripple price recovered recently above $0.3100, but struggled to break $0.3140 against the US dollar.
- The price is currently declining and it might even break the $0.3050 support area in the near term.
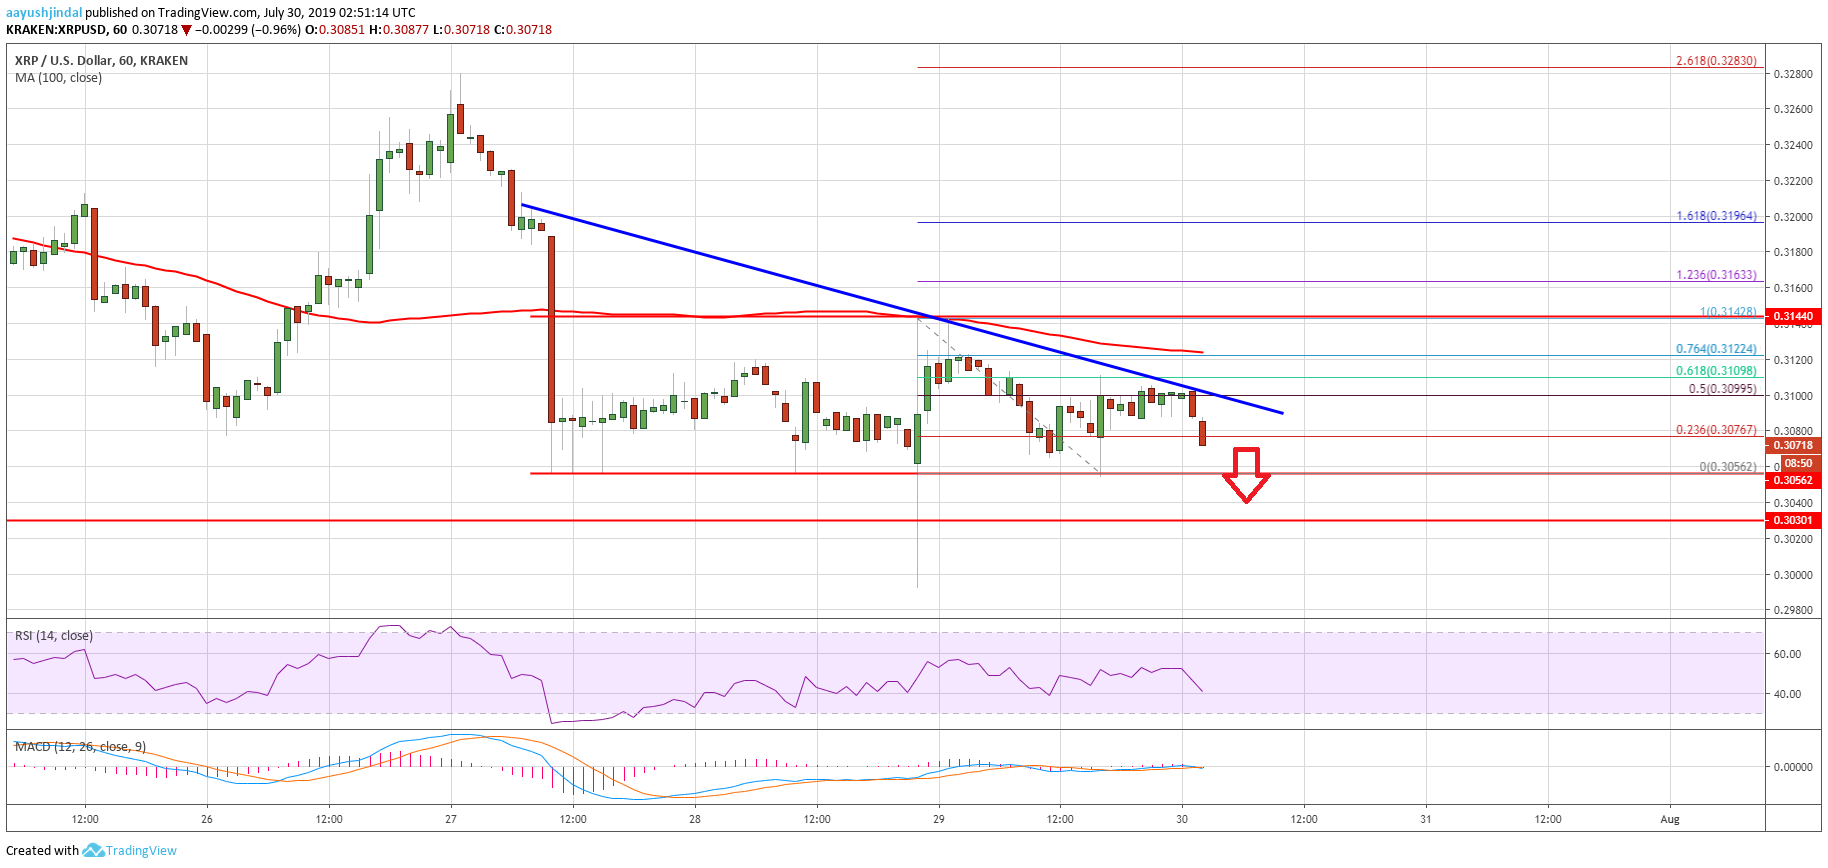
- There is a key bearish trend line forming with resistance near $0.3105 on the hourly chart of the XRP/USD pair (data source from Kraken).
- The price remains at a risk of more downsides as long as there is no break above $0.3140-0.3150.
Ripple price is currently following a bearish pattern against the US Dollar, similar to bitcoin. XRP price could decline heavily if there is a daily close below the $0.3030 support.
Ripple Price Analysis
After a sharp decline, there was an upside correction in bitcoin, Ethereum and ripple against the US Dollar. The XRP/USD pair traded as low as $0.2992 and recovered above the $0.3050 and $0.3100 levels. Moreover, the price recovered above the $0.3120 resistance level. However, the recovery was capped by the $0.3140 resistance zone. The 100 hourly simple moving average (currently at $0.3122) also prevented an upside break.
A swing high was formed near $0.3142 and the price recently corrected lower. The $0.3050 support level prevented a downside break and the price moved back above $0.3080. Additionally, there was a break above the 50% Fib retracement level of the downward move from the $0.3142 high to $0.3056 low. However, the bulls were not able to gain momentum and the price was capped near $0.4100.
The 61.8% Fib retracement level of the downward move from the $0.3142 high to $0.3056 low acted as a resistance. More importantly, there is a key bearish trend line forming with resistance near $0.3105 on the hourly chart of the XRP/USD pair. Above the trend line, the 100 hourly SMA is near the $0.3120 level to cap gains. The main resistance is near the $0.3140-0.3150 area, above which the price could start a strong upward move.
Conversely, if the price fails to break the $0.3100 or $0.3120 resistance, it could continue to slide. An immediate support is near the $0.3050 level. The main support is near $0.3030. If there is a daily close below the $0.3030 and $0.3020 support levels, the price could decline heavily towards $0.2850.
Looking at the chart, ripple price is clearly trading in a downtrend below $0.3140. Having said that, the $0.3030 support holds the key. As long as the price is above $0.3030, it could stage a solid recovery above $0.3140.
Technical Indicators
Hourly MACD – The MACD for XRP/USD is moving into the bearish zone.
Hourly RSI (Relative Strength Index) – The RSI for XRP/USD is moving lower towards the 40 level.
Major Support Levels – $0.3050, $0.3030 and $0.3000.
Major Resistance Levels – $0.3100, $0.3120 and $0.3140.
The post Ripple Price (XRP) Trend Near-Term Negative, Similar To Bitcoin appeared first on NewsBTC.
source https://www.tokentalk.co/NewsBTC/ripple-price-xrp-trend-nearterm-negative-similar-to-bitcoin-5d3fc1b17be5bcbd3bc16202
Monday, 29 July 2019
Ripple Price (XRP) Trend Near-Term Negative, Similar To Bitcoin @newsbtc #Analysis #Technical #Ripple #xrp
Subscribe to:
Post Comments (Atom)
This analyst says there’s a “high chance” Bitcoin may never fall under $5k again @cryptoslate #Analysis #Price Watch
Once Bitcoin (BTC) started to incur strong losses in the second half of 2019, analysts were once again making extremely low price prediction...

-
The Indian Ministry of Commerce and Industry announced yesterday that the Coffee Board in the country is integrating blockchain into the cof...
-
App-enabled cryptocurrency exchange and wallet provider, Zebpay, has announced that it is enabling Lightning Network payments for all its ...
-
Disclaimer: These summaries are provided for educational purposes only by Nelson Rosario and Stephen Palley... Disclaimer: These summaries...

No comments:
Post a Comment