- After a short term upside correction, bitcoin price failed to surpass $10,200 against the US Dollar.
- The price formed a double top near the $10,200 level and declined below the $10,000 support.
- T...
- After a short term upside correction, bitcoin price failed to surpass $10,200 against the US Dollar.
- The price formed a double top near the $10,200 level and declined below the $10,000 support.
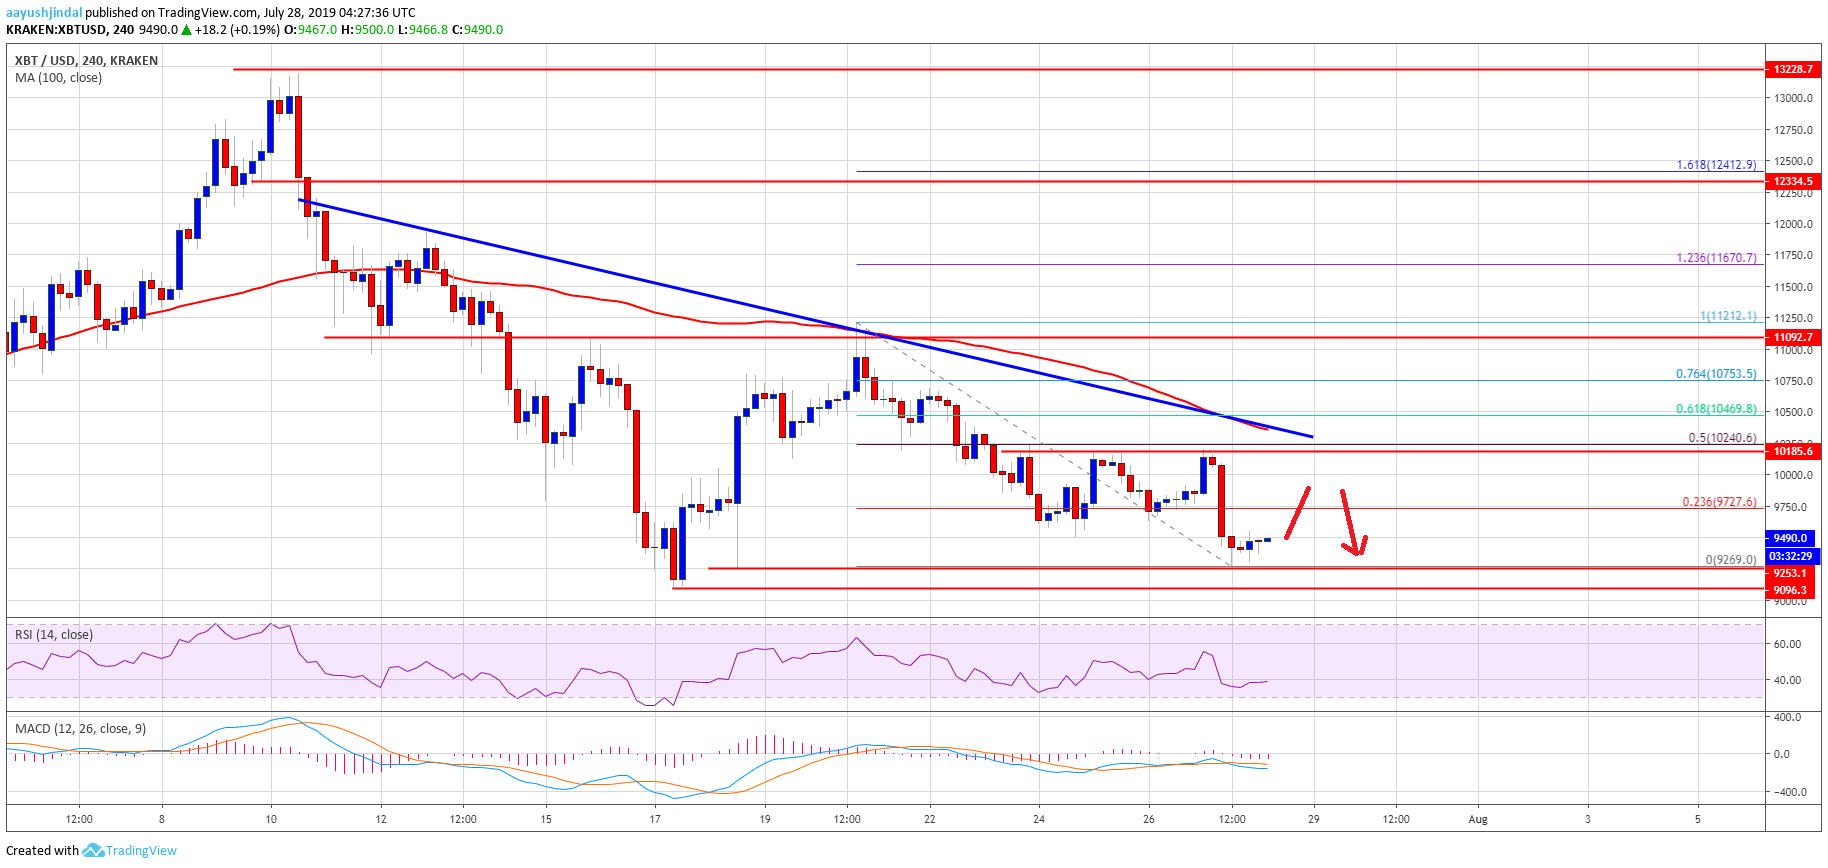
- There is a crucial bearish trend line forming with resistance near $10,350 on the 4-hours chart of the BTC/USD pair (data feed from Kraken).
- The pair could breakdown if it continues to struggle near $10,000, $10,200 and $10,400.
Bitcoin price is currently under pressure after it failed again near $10,200 against the US Dollar. BTC price could decline significantly if it breaks the $9,000 support area.
Bitcoin Price Weekly Analysis (BTC)
This past week, there were mostly bearish moves in bitcoin price below the $10,400 pivot level against the US Dollar. The BTC/USD pair attempted an upside correction above the $10,000 level, but the $10,200 level acted as a strong resistance. Moreover, there were two attempts this past week to clear the $10,200 resistance, but the bulls failed to gain momentum. As a result, there was a break below $10,000 and the price settled well below the 100 simple moving average (4-hours).
The price recently traded below the $9,500 support and formed a new swing low near $9,269. It is currently consolidating losses, with an immediate resistance near the $9,700 level. Moreover, the 23.6% Fib retracement level of the recent drop from the $11,092 high to $9,269 low is also near the $9,730 level to act as a resistance. More importantly, there is a crucial bearish trend line forming with resistance near $10,350 on the 4-hours chart of the BTC/USD pair.
The trend line coincides with the 100 simple moving average (4-hours) plus the 50% Fib retracement level of the recent drop from the $11,092 high to $9,269 low. Therefore, it won’t be easy for the bulls to push the price above the $10,200 and $10,400 resistance levels. Above $10,400, the price could recover towards the $11,000 resistance level.
On the downside, there are a few supports near the $9,200 and $9,100 levels. If the price continues to struggle below the $10,000 and $10,200 levels, there is a risk of a sharp decline. The main support is near $9,000, below which the price could tumble towards the $8,450 level.
Looking at the chart, bitcoin price is clearly trading with a bearish bias below the $10,000 and $10,200 resistance levels. Until there is a daily close above $10,400, there are chances of more downsides below $9,000.
Technical indicators
4 hours MACD – The MACD for BTC/USD is currently placed in the bearish zone.
4 hours RSI (Relative Strength Index) – The RSI for BTC/USD is currently recovering above the 40 level.
Major Support Level – $9,100
Major Resistance Level – $10,400
The post Bitcoin (BTC) Price Weekly Forecast: Risk Of Significant Downside Break appeared first on NewsBTC.
source https://www.tokentalk.co/NewsBTC/bitcoin-btc-price-weekly-forecast-risk-of-significant-downside-break-5d3d3260566433bd6b277cb5
Sunday, 28 July 2019
Bitcoin (BTC) Price Weekly Forecast: Risk Of Significant Downside Break @newsbtc #Analysis #Technical #bitcoin #btc
Subscribe to:
Post Comments (Atom)
This analyst says there’s a “high chance” Bitcoin may never fall under $5k again @cryptoslate #Analysis #Price Watch
Once Bitcoin (BTC) started to incur strong losses in the second half of 2019, analysts were once again making extremely low price prediction...

-
The Indian Ministry of Commerce and Industry announced yesterday that the Coffee Board in the country is integrating blockchain into the cof...
-
App-enabled cryptocurrency exchange and wallet provider, Zebpay, has announced that it is enabling Lightning Network payments for all its ...
-
Disclaimer: These summaries are provided for educational purposes only by Nelson Rosario and Stephen Palley... Disclaimer: These summaries...

No comments:
Post a Comment