- ETH price remained supported above the $200 level and recovered slightly support against the US Dollar.
- The price climbed above $220, but it faced a strong resistance near the $225 level.
- Earlier...
- ETH price remained supported above the $200 level and recovered slightly support against the US Dollar.
- The price climbed above $220, but it faced a strong resistance near the $225 level.
- Earlier, there was a break above a major bearish trend line with resistance near $212 on the 4-hours chart of ETH/USD (data feed via Kraken).
- The pair is currently at a risk of more losses unless it climbs above the $225 and $235 resistances.
Ethereum price is showing signs of weakness against the US Dollar and bitcoin. ETH price is likely to break the $200 support if it continues to struggle near $225.
Ethereum Price Weekly Analysis
This past week, there was a short term recovery in bitcoin and Ethereum against the US Dollar. The ETH/USD pair formed a decent support base near the $200 level and later started an upside correction. It traded above the $210 and $215 resistance levels. Moreover, there was a break above the 23.6% Fib retracement level of the downward move from the $279 high to $191 low.
Additionally, there was a break above a major bearish trend line with resistance near $212 on the 4-hours chart of ETH/USD. The pair even traded above the $220 level, but it remained well below the 100 simple moving average (4-hours). It seems like the $225 level acted as a strong resistance and prevented more gains. There were two rejections noted near the $225 level before the price declined below $220.
Moreover, the price remained well below the 50% Fib retracement level of the downward move from the $279 high to $191 low. On the upside, it seems like there are a few important resistances forming near $225, $230 and $235. The 100 simple moving average (4-hours) is near the $230 level to act as strong hurdle for the bulls. Therefore, a close above the 100 simple moving average (4-hours) and $235 is needed for an upward move.
On the downside, the main support is near the $200 level. If there is a downside break below the $200 support, the price could break the last swing low near $191 and accelerate losses in the coming sessions.
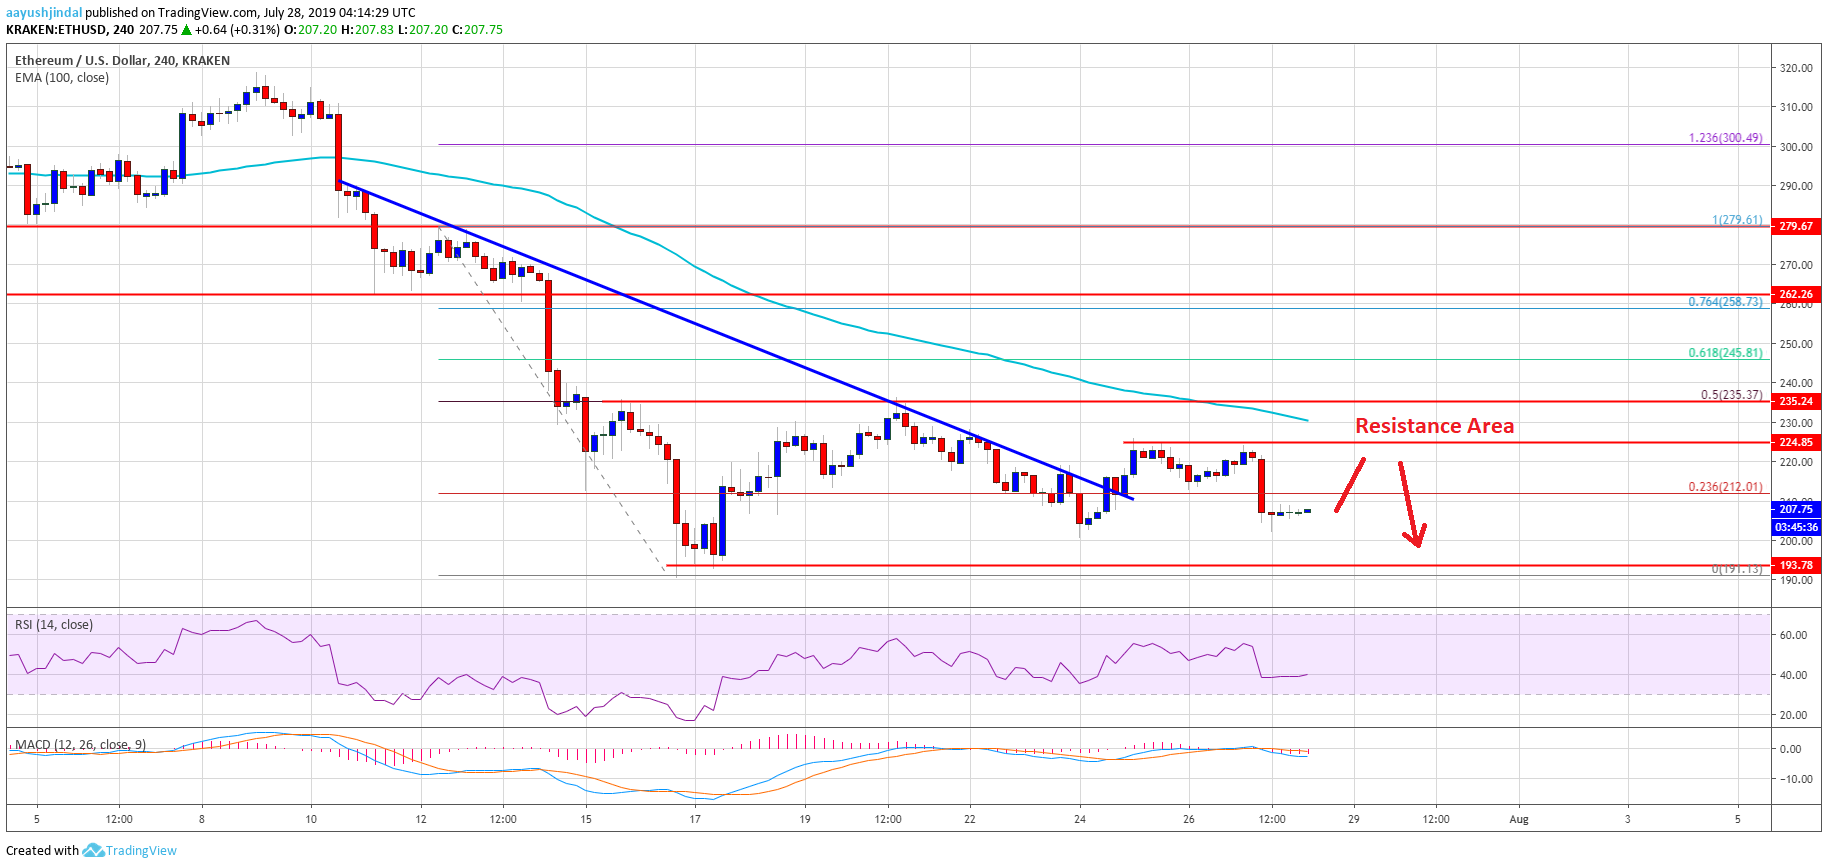
The above chart indicates that Ethereum price is facing an uphill task near the $225 and $230 levels. Until there is a close above the $235 barrier, there is a risk of more downsides below $200. The next key supports are near $191 and $184.
Technical Indicators
4 hours MACD – The MACD for ETH/USD is currently placed heavily in the bearish zone.
4 hours RSI – The RSI for ETH/USD is currently near the 40 level, with a minor bullish angle.
Major Support Level – $200
Major Resistance Level – $230
The post Ethereum Price Weekly Forecast: ETH Bulls Facing Uphill Task appeared first on NewsBTC.
source https://www.tokentalk.co/NewsBTC/ethereum-price-weekly-forecast-eth-bulls-facing-uphill-task-5d3d2360566433bd6b277cb3
Sunday, 28 July 2019
Ethereum Price Weekly Forecast: ETH Bulls Facing Uphill Task @newsbtc #Analysis #Technical #ETH #ethereum
Subscribe to:
Post Comments (Atom)
This analyst says there’s a “high chance” Bitcoin may never fall under $5k again @cryptoslate #Analysis #Price Watch
Once Bitcoin (BTC) started to incur strong losses in the second half of 2019, analysts were once again making extremely low price prediction...

-
The Indian Ministry of Commerce and Industry announced yesterday that the Coffee Board in the country is integrating blockchain into the cof...
-
App-enabled cryptocurrency exchange and wallet provider, Zebpay, has announced that it is enabling Lightning Network payments for all its ...
-
Once Bitcoin (BTC) started to incur strong losses in the second half of 2019, analysts were once again making extremely low price prediction...


No comments:
Post a Comment