- ETH price remained supported above the $205 level, but struggled to gain traction against the US Dollar.
- The price is facing a few key resistances near the $212 and $215 levels.
- There is a contra...
- ETH price remained supported above the $205 level, but struggled to gain traction against the US Dollar.
- The price is facing a few key resistances near the $212 and $215 levels.
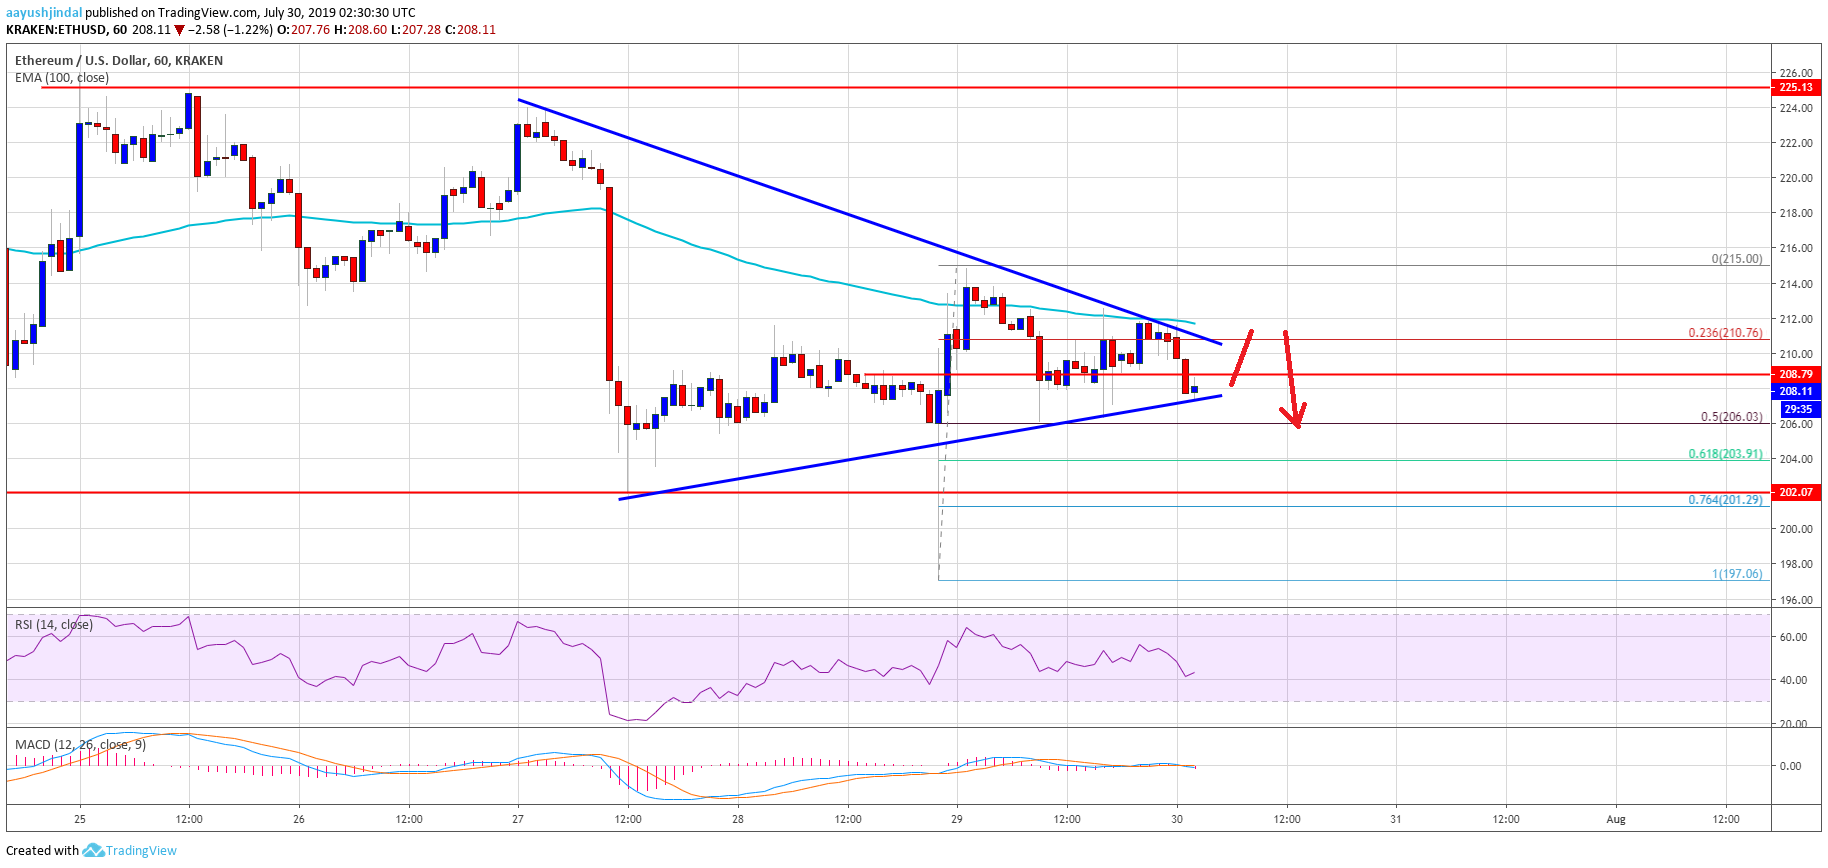
- There is a contracting triangle forming with resistance near $211 on the hourly chart of ETH/USD (data feed via Kraken).
- The pair could either rally above the $215 resistance or it might soon retest the $200 support level.
Ethereum price is still facing a strong selling interest versus the US Dollar and bitcoin. ETH price needs to surpass the $215 resistance to avoid a downside break.
Ethereum Price Analysis
After a sharp dip below the $205 and $200 levels, Ethereum price started an upside correction against the US Dollar. The ETH/USD pair formed a swing low near $197 and recently recovered above the $205 and $210 levels. However, the upward move was capped by the $215 resistance level. Moreover, the 100 hourly simple moving average (currently near $212) also acted as a strong resistance.
The price topped near the $215 level and recently corrected gains. It broke the $210 level plus the 23.6% Fib retracement level of the recent recovery from the $197 low to $215 high. However, the declined was protected by the $205 support level. Moreover, the 50% Fib retracement level of the recent recovery from the $197 low to $215 high acted as a decent support zone.
At the moment, it seems like there is a contracting triangle forming with resistance near $211 on the hourly chart of ETH/USD. On the upside, there is a crucial resistance forming near $211, $212, and the 100 hourly SMA. If there is an upside break above $212, the price is likely to rally above the $215 resistance. In the mentioned case, the next possible target for the bulls could be $225.
On the other hand, if the price fails to break the $212 resistance zone, there could be a fresh bearish wave. An initial support is near the $205 level, below which the price could test the main $200 support level. Any further gains will most likely open the doors for more losses towards the $185 support level.
Looking at the chart, Ethereum price is showing a few negative signs below the $211-212 resistance area. The bulls need to soon gain pace above $212 to start a decent upward move. If not, the price is likely to react to the downside towards or below $200 in the near term.
ETH Technical Indicators
Hourly MACD – The MACD for ETH/USD is slowly moving into the bearish zone.
Hourly RSI – The RSI for ETH/USD is currently below the 50 level and holding the 40 level.
Major Support Level – $205
Major Resistance Level – $212
The post Ethereum Price (ETH) Flirts With Key Resistance Amid Negative Sentiment appeared first on NewsBTC.
source https://www.tokentalk.co/NewsBTC/ethereum-price-eth-flirts-with-key-resistance-amid-negative-sentiment-5d3fb3a17be5bcbd3bc16200
Monday, 29 July 2019
Ethereum Price (ETH) Flirts With Key Resistance Amid Negative Sentiment @newsbtc #Analysis #Technical #ETH #ethereum
Subscribe to:
Post Comments (Atom)
This analyst says there’s a “high chance” Bitcoin may never fall under $5k again @cryptoslate #Analysis #Price Watch
Once Bitcoin (BTC) started to incur strong losses in the second half of 2019, analysts were once again making extremely low price prediction...

-
The Indian Ministry of Commerce and Industry announced yesterday that the Coffee Board in the country is integrating blockchain into the cof...
-
App-enabled cryptocurrency exchange and wallet provider, Zebpay, has announced that it is enabling Lightning Network payments for all its ...
-
Disclaimer: These summaries are provided for educational purposes only by Nelson Rosario and Stephen Palley... Disclaimer: These summaries...

No comments:
Post a Comment